ATA Truck Tonnage Index Decreased 1.1% in July
Aug 24, 2022Index 5.1% Above July 2021
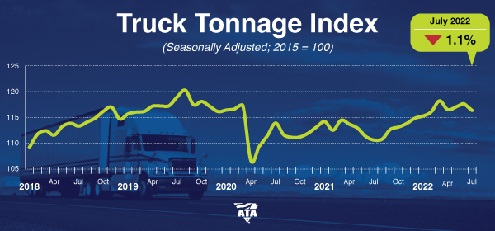
American Trucking Associations’ advanced seasonally adjusted (SA) For-Hire Truck Tonnage Index fell 1.1% in July after rising 0.5% in June. In July, the index equaled 116.2 (2015=100) versus 117.5 in June.
“Tonnage declined sequentially in July for only the second time during the last twelve months. Despite the dip from June, tonnage remains at elevated levels and increased significantly from a year earlier,” said ATA Chief Economist Bob Costello. “While tonnage is much stronger than a year ago, the monthly gains have moderated as the year has gone on. The combination of softer consumption of goods, home construction falling and slower manufacturing activity are the main reasons.”
June’s increase was revised down from our July 19 press release.
Compared with July 2021, the SA index increased 5.1%, which was the eleventh straight year-over-year gain. In June, the index was up 5.6% from a year earlier. Year-to-date, compared with the same period in 2021, tonnage was up 3.4%.
The not seasonally adjusted index, which represents the change in tonnage actually hauled by fleets before any seasonal adjustment, equaled 115.5 in July, 5.2% below the June level (121.9). In calculating the index, 100 represents 2015. ATA’s For-Hire Truck Tonnage Index is dominated by contract freight as opposed to spot market freight.
Trucking serves as a barometer of the U.S. economy, representing 72.5% of tonnage carried by all modes of domestic freight transportation, including manufactured and retail goods. Trucks hauled 10.23 billion tons of freight in 2020. Motor carriers collected $732.3 billion, or 80.4% of total revenue earned by all transport modes.
ATA calculates the tonnage index based on surveys from its membership and has been doing so since the 1970s. This is a preliminary figure and subject to change in the final report issued around the 5th day of each month. The report includes month-to-month and year-over-year results, relevant economic comparisons, and key financial indicators.
Similar Stories

North American Transborder Freight increased 19.4% in April 2026 from April 2025
View Article
Schneider appoints manufacturing leader Ramirez to Board of Directors
View Article
PSA Intermodal Italy and Logtainer sign agreement to manage Padova Intermodal Terminal as PSA Padova
View Article
CN releases 2025 Sustainability Data Supplement and highlights sustainability recognitions
View ArticleTruckstop.com introduces Broker Assistant and Carrier Hub to streamline freight broker operations
View Article
At 70 years old, the U.S. Interstate Highway System delivers vital benefits but faces severe congestion and decay
View ArticleGet the most up-to-date trending news!
SubscribeIndustry updates and weekly newsletter direct to your inbox!
Follow us on social media:
![]()
![]()


