
US international investment position, third quarter 2021
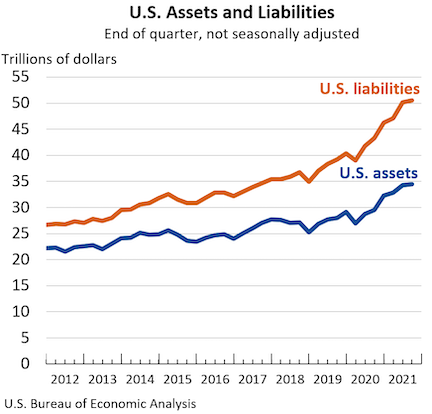
Dec 30, 2021The U.S. net international investment position (IIP), the difference between U.S. residents' foreign financial assets and liabilities, was –$16.07 trillion at the end of the third quarter of 2021, according to statistics released today by the U.S. Bureau of Economic Analysis (BEA). Assets totaled $34.45 trillion, and liabilities were $50.53 trillion. At the end of the second quarter, the net investment position was –$15.91 trillion. The net investment positions and components of assets and liabilities are presented in table 1.
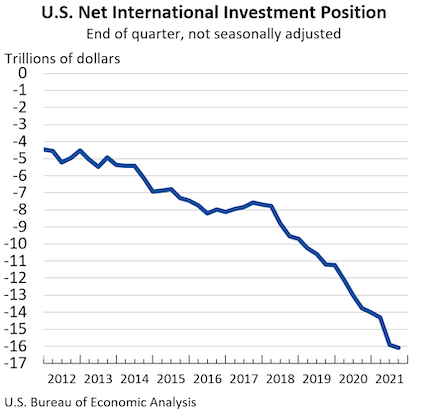
The –$165.1 billion change in the net investment position from the second quarter to the third quarter came from net financial transactions of –$114.0 billion and net other changes in position, such as price and exchange-rate changes, of –$51.1 billion that mostly reflected the depreciation of major foreign currencies against the U.S. dollar that lowered the value of U.S. assets in dollar terms.
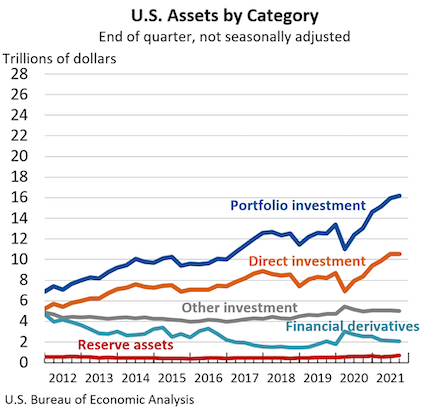
U.S. assets increased by $181.2 billion to a total of $34.45 trillion at the end of the third quarter, reflecting increases in portfolio investment and reserve assets. Portfolio investment assets increased by $194.3 billion to $16.16 trillion, driven by net U.S. purchases of foreign securities. Reserve assets increased by $105.0 billion to $695.1 billion, reflecting the allocation of $112.8 billion in new special drawing rights (SDRs) in August 2021 to the United States as its share of the $650 billion SDR allocation approved by the International Monetary Fund (IMF). The SDR is an international reserve asset created by the IMF to supplement its member countries' official reserves and can be exchanged between members for currencies such as the U.S. dollar, the euro, or the yen. The allocation in the third quarter was the largest in the history of the IMF.
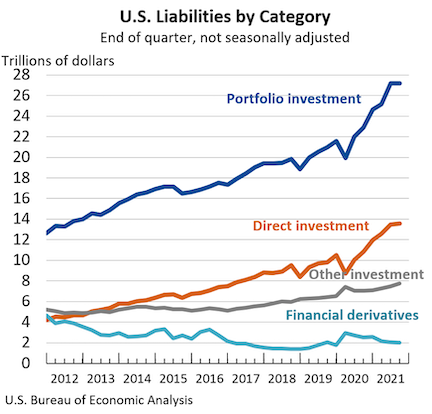
U.S. liabilities increased by $346.3 billion to a total of $50.53 trillion at the end of the third quarter, mostly reflecting increases in other investment liabilities. Other investment liabilities increased by $294.8 billion to $7.77 trillion, reflecting increases in deposit liabilities and in SDR allocation liabilities that represent the U.S. long-term obligation to other IMF member countries holding SDRs. In an SDR alloc/p>he increase in U.S. liabilities offsets the increase in U.S. assets, so the allocation has no impact on the net international investment position.
Updates to Second Quarter 2021 International Investment Position Aggregates Trillions of dollars, not seasonally adjusted | ||
|
Preliminary estimate |
Revised estimate |
U.S. net international investment position |
-15.42 |
-15.91 |
U.S. assets |
34.20 |
34.27 |
U.S. liabilities |
49.62 |
50.18 |
Releases of New Statistics
With this release of the U.S. IIP Accounts, BEA is introducing two new IIP tables—tables 2.2 and 4.1. IIP table 2.2 features annual statistics on direct investment positions in U.S. resident special purpose entities (SPEs), which are U.S. legal entities with little or no employment or physical presence. The increased prevalence of SPEs heightens the need for separate statistics on their activities for analysis and for improved interpretability of macroeconomic statistics. IIP table 4.1 features quarter-end position statistics on U.S. debt positions by currency, sector, and maturity for U.S. assets and liabilities. These statistics will be valuable for assessing U.S. exposure to foreign currency risks and for helping to identify potential future financial crises. The new tables fulfill commitments to the IMF Task Force on Special Purpose Entities(link is external) and the G–20 Data Gaps Initiative(link is external) to release these statistics by yearend 2021. For more information, see "New Statistics on U.S. Resident Special Purpose Entities in the International Investment Position Accounts" and "New Statistics on U.S. Debt Positions in the International Investment Position Accounts."
Accelerating Release of Annual IIP Statistics
BEA will accelerate the publication of the annual IIP table 1.3 usually released in June each year to March each year. Table 1.3 provides details for the annual change in the IIP, such as financial transactions, price changes, exchange-rate changes, and other changes in volume and valuation. For the upcoming IIP release on March 29, 2022, BEA will include table 1.3 for 2021, which will also be available in BEA's Interactive Data Application. The table will subsequently be updated as part of the annual update in June each year.
Similar Stories

Port Laredo awarded new $25 million BUILD grant to support US-Mexico trade
View Article
USMCA figures prominently at GSDF 2026 event in New York City
View Article
Steel trade closely watches Brownsville port’s channel deepening project
View Article
Florida produce sees opportunity with non-renewal of USMCA
View Article
Heightened Chinese Coast Guard patrols in Taiwan Strait may impact East Asia shipping
View Article“K” LINE to support relief efforts following earthquake off the Coast of Mindanao
The earthquake that struck off the coast of Mindanao, the Philippines, on June 8 caused severe damage in a number of regions.
View ArticleGet the most up-to-date trending news!
SubscribeIndustry updates and weekly newsletter direct to your inbox!
Follow us on social media:


