Transborder Freight Data annual report 2025
Mar 17, 2026This release is published on a fixed schedule as required by the Office of Management and Budget, and statistics in this release may be revised when inputs to the statistics are corrected or updated. Data on the program page of this website are the most up-to-date and complete.
Transborder data is available for 2025. The Bureau of Transportation Statistics has compiled the dollar value of commodities that moved across the United States’ land borders with Canada and Mexico by mode of transportation. Manufacturing and logistics sectors across North America are linked and interdependent. America’s land borders with Canada and Mexico are economically vital conduits for North American supply chains, with about $4.0 billion in daily cross-border freight shipments. In addition to oil and energy products, automobiles, and electronics, Canada and Mexico are also America’s largest trading partners in agricultural goods.
U.S. land borders with Canada and Mexico consistently facilitate over $1 trillion in cross-border trade annually. By comparison, in 2025 the value of total U.S.-international trade was $5.3 trillion, of which U.S. trade with Canada and Mexico comprised nearly one-third. In 2025, U.S. freight flows with Canada and Mexico equaled $1.6 trillion, a 1% decrease over 2024. Freight between the U.S. and Canada was $712.8 billion in 2025, down 6.4% from 2024. Freight between the U.S. and Mexico was $872.8 billion in 2025, up 3.9% from 2024.
Surface transportation (truck + rail + pipeline) serves as the foundation of North American commerce, facilitating over 80% of all freight by value. Trucking remains the leader, carrying 55.7% of trade with Canada and 73.6% with Mexico. While rail remains vital across both borders, Canada’s modal profile is uniquely bolstered by pipeline shipments. In 2025, mineral fuels moved via pipeline ranked as the second-largest mode for U.S.-Canada trade at 13.4%, narrowly outpacing rail’s 12.6% share. Meanwhile, rail accounted for a consistent 10.9% of freight value with Mexico. All data in this report is sourced from BTS Transborder Freight Data.
U.S.-North American Freight Points.
- Total transborder freight: $1.6 trillion of transborder freight moved by all modes of transportation, a 1.0% decrease compared to 2024
- Freight between the U.S. and Canada: $712.8 billion, down 6.4% from 2024
- Freight between the U.S. and Mexico: $872.8 billion, up 3.9% from 2024
- Trucks moved $1.0 trillion of freight, up 0.7% compared to 2024
- Railways moved $184.5 billion of freight, down 9.2% compared to 2024
- Pipelines moved $103.9 billion of freight, down 2.5% compared to 2024
- Vessels moved $101.4 billion of freight, down 15.6% compared to 2024
- Air moved $66.1 billion of freight, up 17.7% compared to 2024
- Vessel and pipeline freight decreased due to the lower dollar value of mineral fuels
In many ways, America’s geographic position in North America is a tale of two borders: energy from the north and manufacturing from the south. Transborder freight activity data reveals two different trade profiles that keep the U.S. economy running. The U.S.-Canada relationship is defined by energy and natural resources, with pipelines and rail moving large volumes of fuel and timber. Conversely, the U.S.-Mexico relationship is defined by its manufacturing and labor dominance, with finished goods moving by truck. This dual-profile trade strategy provides North American supply chains with stability and diversification.
Table 4a. U.S.-Canada Freight by Truck: 2025
Top 10 Ports % Export % Import % of Total Value ($M) YOY Change Detroit - Michigan 57.8 42.2 23.7% 94,175,491,991 -17.5% Port Huron - Michigan 48.9 51.1 22.0% 87,332,134,629 11.3% Buffalo - Niagara Falls - New York 53.2 46.8 17.7% 70,076,028,739 -3.1% Pembina - North Dakota 59.9 40.1 5.4% 21,336,936,148 -11.5% Champlain - Rouses Point - New York 40.1 59.9 5.1% 20,248,934,993 -9.1% Blaine - Washington 53.6 46.4 4.7% 18,532,910,439 -7.2% Alexandria Bay - New York 44.9 55.1 3.6% 14,321,479,018 -18.5% Sweetgrass - Montana 48.0 52.0 3.6% 14,181,882,909 -6.1% Portal - North Dakota 69.1 30.9 3.1% 12,441,987,689 -6.1% Highgate Springs/ Alburg - Vermont 28.7 71.3 1.0% 4,154,001,438 -4.7%
Top 10 Truck Commodities % Export % Import % of Total Value ($M) YOY
ChangeComputer-Related Machinery and Parts 60.2 39.8 16.9% 67,040,488,225 -4.0% Vehicles Other than Railway 51.4 48.9 13.2% 52,226,677,856 -11.2% Electrical Machinery Equipment and Parts 67.6 32.4 7.2% 28,450,418,556 -5.1% Special Classification Provisions 23.9 76.1 4.8% 19,099,444,970 -4.3% Plastics and Articles 50.8 49.2 4.8% 18,925,797,886 -8.6% Pearls; Stones; Metals and Imitation Jewelry 42.4 57.6 4.1% 16,269,492,246 24.0% Pharmaceutical Products 64.4 35.6 2.4% 9,665,353,285 -11.9% Paper and Paperboard 43.6 56.4 2.4% 9,651,194,313 -8.0% Preparations of Cereals and Flour 30.8 69.2 2.4% 9,424,615,117 -3.8% Measuring and Testing Instruments 67.9 32.1 2.3% 9,012,512,372 -4.6%
Table 4b. U.S.-Mexico Freight by Truck: 2025
Top 10 Ports % Export % Import % of Total Value ($M) YOY
ChangeLaredo 35.3 64.7 46.1% 296,244,922,829 5.1% Ysleta Port of Entry 34.4 65.6 17.5% 112,399,054,531 34.8% Otay Mesa - California 35.3 64.7 9.1% 58,620,229,904 -3.8% Hidalgo - Texas 29.6 70.4 6.3% 40,756,498,670 -4.3% Santa Teresa - New Mexico 35.3 64.7 5.1% 33,021,537,321 -14.9% Nogales - Arizona 34.4 65.6 4.0% 25,427,405,680 1.5% Calexico - East California 40.7 59.3 3.1% 19,782,928,928 -9.7% Brownsville - Texas 48.7 51.3 2.3% 14,947,476,225 -6.5% El Paso - Texas 76.5 23.5 1.9% 12,070,197,482 16.1% Eagle Pass - Texas 42.2 57.8 1.6%
10,191,331,156 -7.3%
Top 10 Truck Commodities % Export % Import % of Total Value ($M) YOY
ChangeComputer-Related Machinery and Parts 27.4 72.6 29.4% 189,115,884,089 31.2% Electrical Machinery; Equipment and Parts 37.8 62.2 21.3% 136,851,006,961 2.7% Vehicles Other than Railway 23.2 76.8 12.0% 77,307,194,186 -9.2% Measuring and Testing Instruments 30.0 70.0 5.0% 31,824,349,129 0.6% Plastics and Articles 70.4 29.6 3.9% 25,221,556,068 -0.6% Furniture; Lamps and Prefabricated Buildings 12.9 87.1 2.1% 13,650,768,737 -3.6% Articles of Iron and Steel 56.6 43.4 1.9% 12,252,183,392 -12.1% Edible Fruit and Nuts 12.0 88.0 1.8% 11,262,454,584 -6.2% Special Classification Provisions 1.8 98.2 1.4% 9,211,724,101 21.6% Edible Vegetables and Roots 5.3 94.7 1.3% 8,488,392,319 -18.9%
U.S.-Canada Data Points
- Detroit, Port Huron, and Buffalo are the top truck ports for U.S. freight flows with Canada.
- Detroit, Port Huron, and International Falls are the top rail connection ports for U.S. freight flows with Canada.
- Chicago, Port Huron, and Minneapolis are the top pipeline connection regions for U.S. energy freight flows with Canada.
- Port of Boston, Arthur, and Portland are the top water port connections for U.S. energy flows with Canada.
U.S.-Mexico Data Points
- Laredo, Ysleta, and Otay Mesa are the top truck ports with Mexico.
- Laredo, Eagle Pass, and El Paso are the top rail connection ports with Mexico.
- El Paso, Hidalgo, and Laredo are the top pipeline connection regions with Mexico.
- Port of Houston, Arthur, and Texas City are the top water port connections for U.S. energy flows on the Southern border.
- Energy flows by vessel with Mexico are more expansive than pipeline flows with Canada.
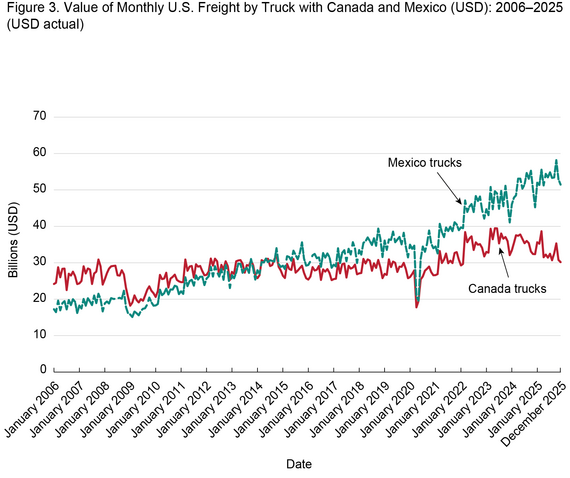
The value of freight shipments by truck with Canada and Mexico reveals another emerging long-term trend. Historically, Canada was the dominant trucking partner. However, around 2015, the two lines began to converge. Starting in 2015, there have been several periods where U.S. freight with Mexico by value has surpassed that of Canada. Shipments from Mexico by truck have accelerated, highlighting Mexico's growing role as the primary manufacturing hub south of the border. From the pandemic lows in April 2020 to December 2025, freight by truck with Canada has increased from $17.8 billion to $30.2 billion while freight by truck with Mexico has grown from $20.8 billion to $51.5 billion. Mexico’s trucking trade value is now roughly 50% higher than Canada's. This likely reflects broader economic trends such as "nearshoring," where manufacturing has shifted from Asia to Mexico to be closer to the U.S. market.
Border Resiliency
The border resiliency data provide an assessment of U.S. land borders, prioritizing gateway resiliency and redundancy. By analyzing freight values and crossing volumes, a binational working group identified high-consequence ports vulnerable to supply chain disruptions. This collaboration establishes a joint risk-measurement framework designed to mitigate bottlenecks and ensure a more secure, resilient border for U.S.-North America freight transportation.
The Port of Laredo, Texas, remains the premier gateway for North American trade, facilitating over $296.2 billion in annual freight. Laredo alone handles almost 6 million truck crossings annually. From a resiliency perspective, the corridor’s stability is bolstered by its proximity to Colombia-Solidarity, which serves as a critical alternative crossing just 20 miles away. Similarly, in the north, the Detroit-Windsor crossing remains the vital artery for the automotive industry, handling $94.2 billion in trade with Port Huron serving as its primary 65-mile resiliency partner. The completion of the new Gordie Howe International Bridge is set to provide a critical redundancy in the Detroit-Windsor corridor, significantly enhancing freight resiliency by offering a modern, high-capacity alternative that reduces congestion and alleviates the safety risks associated with aging infrastructure.
Key Resiliency Points
- The Laredo Congestion Point: Laredo, TX is the most critical land port in North America, handling nearly $300B in trade--the busiest land port for trade value and truck volume, consistently reaching high risk levels for congestion. While Colombia-Solidarity is an alternative, it is only 20 miles away, meaning a major regional disruption (like the 2024 supply chain shifts or labor strikes) would likely saturate the entire corridor.
- The Detroit-Port Huron Corridor: The Detroit/Port Huron corridor has a significant 65-mile gap to the next nearest crossing, which contributes to the "High" risk rating during disruptions. These two Michigan ports act as each other's primary relief valves. However, at 65 miles apart and with specific infrastructure (bridges vs. tunnels), they require significant coordination for true resiliency during an outage.
- Southern Border Imports: Crossings like Hidalgo, TX and Nogales, AZ are heavily weighted toward imports (70% and 65% respectively), primarily driven by the "just-in-time" fresh produce and automotive supply chains from Mexico. Mexico crossings average significantly higher wait times (approx. 40 mins) compared to Canadian crossings (approx. 22 mins) due to higher inspection densities.
- Northern Redundancy: Buffalo and Niagara have a relatively short relief distance of 36 miles, making this one of the more resilient segments of the Northern border compared to remote ports like Pembina, ND.
Table 5a. Top 10 U.S. - Canada Freight Crossings: 2025
Port Name Risk Level Export
(%)Import
(%)Share of
Corridor (%)Total Trade
Value (USD)Truck
CrossingsRail
CrossingsDetroit - Michigan HIGH 55.7 44.3 0.1765 125,810,318,941 1,132,176 94,800 Port Huron - Michigan HIGH 46.8 53.2 0.1636 116,609,296,011 916,222 80,200 Buffalo - New York HIGH 48.7 51.3 0.1107 78,906,031,974 865,370 52,400 Chicago Customs District MOD 0.1 99.9 0.0564 40,172,651,901 626,800 23,400 Pembina - North Dakota MOD 60.2 39.8 0.0447 31,867,846,862 269,604 16,800 Champlain - New York MOD 39.2 60.8 0.032 22,834,704,180 330,536 4,400 Blaine - Washington MOD 48.6 51.4 0.0315 22,459,759,240 580,210 15,600 Portal - North Dakota MOD 58.2 41.8 0.0259 18,435,193,936 286,200 5,800 Sweetgrass - Montana LOW 42.7 57.3 0.025 17,808,449,201 251,200 13,400 Alexandria Bay - New York LOW 44.9 55.1 0.0201 14,331,702,782 178,200 -
Port Name Risk
LevelPersonal Vehicle
CrossingsCBP
OfficersNearest
Alt Crossing
(mi)Nearest Alt
Crossing NameAvg Truck
Wait
(min)Top Commodity Detroit - Michigan HIGH 3,468,294 412 60 Blue Water Bridge 24 Auto Parts Port Huron - Michigan HIGH 822,138 380 60 Ambassador Bridge 16 Machinery Buffalo - New York HIGH 3,678,378 298 36 Lewiston-Queenston Bridge 32 Food Products Chicago Customs District MOD 202,400 110 20 Regional Hub / Detroit 13 Petroleum / Grain Pembina - North Dakota MOD 888,340 94 5 Emerson - Pembina 10 Lumber / Paper Products Champlain - New York MOD 2,433,220 84 13 Overton Corners - Lacolle 17 Consumer Goods / Agriculture Blaine - Washington MOD 1,980,550 245 12 Lynden - Aldergrove 28 Wood / Produce Portal - North Dakota MOD 112,800 64 48 Northgate 7 Petroleum / Agriculture Sweetgrass - Montana LOW 61,600 55 23 Coutts 6 Potash / Grain Alexandria Bay - New York LOW 296,600 40 12 Thousand Islands Bridge 5 Dairy / Forest Products
Table 5b. Top 10 U.S.-Mexico Freight Crossings: 2025
Port Name Risk
LevelExports
(%)Imports
(%)Share of
Corridor (%)Total Trade
Value (USD)Truck
CrossingsRail
CrossingsLaredo - Texas HIGH 36.8 63.2 0.3948 344,553,742,638 2,850,400 290,100 Ysleta - Texas HIGH 34.4 65.6 0.1288 112,402,976,156 956,000 79,200 Otay Mesa - California HIGH 35.8 64.2 0.0687 59,978,979,505 1,210,500 - El Paso - Texas MOD 52.3 47.7 0.0308 26,858,467,552 980,600 115,200 Eagle Pass - Texas MOD 27.9 72.1 0.0496 43,254,375,811 245,000 185,400 Hidalgo - Texas MOD 33.3 66.7 0.0494 43,131,075,577 720,300 - Nogales - Arizona MOD 33.2 66.8 0.0386 33,724,079,626 848,600 46,400 Brownsville - Texas MOD 56.1 43.9 0.022 19,240,098,228 311,600 21,600 Santa Teresa - New Mexico LOW 34.9 65.1 0.0382 33,380,152,806 775,600 21,600 Calexico - East - California LOW 41.2 58.8 0.0229 20,021,838,524 582,400 21,600
Port Name Risk
LevelPersonal
Vehicle
CrossingCBP
OfficersNearest Alt
Crossing
(mi)Nearest Alt
Crossing NameAvg Truck
Wait
(min)Top Commodity Laredo - Texas HIGH 4,120,000 840 20 Colombia Solidarity in Bridge 45 Vehicle Parts/ Machinery Ysleta - Texas HIGH 7,784,755 508 12 Bridge of the Americas 56 Electrical Equip./ Auto Parts Otay Mesa - California HIGH 5,800,000 510 7 San Ysidro 55 Auto Parts / Medical Supplies El Paso - Texas MOD 8,240,000 620 10 Ysleta - Zaragoza 40 Auto Parts / Electrical Equip. Eagle Pass - Texas MOD 1,850,000 210 55 Laredo - World Trade Bridge 22 Steel / Auto Hidalgo - Texas MOD 4,950,200 380 10 Pharr - Reynosa Bridge 38 Produce Nogales - Arizona MOD 460,200 182 15 Mariposa Port of Entry 23 Auto Parts / Agriculture Brownsville - Texas MOD 840,000 108 55 Veterans Intl Bridge 47 Coal / Automotive Santa Teresa - New Mexico LOW 4,914,000 168 5 El Paso Port of Entry 43 Produce / Beverages Calexico - East - California LOW 2,075,000 124 20 Calexico - West 39 Steel / Agriculture Truck crossing data reflect estimates of bidirectional counts, as CBP does not collect comparable outbound data. Rail crossings reflect loaded car equivalents. CBP Officers reflects authorized FY2025 positions. Avg Truck Wait (min) reflects peak-hour estimates from CBP WAIT app data, 2025.
Similar Stories

Port Laredo awarded new $25 million BUILD grant to support US-Mexico trade
View Article
USMCA figures prominently at GSDF 2026 event in New York City
View Article
Steel trade closely watches Brownsville port’s channel deepening project
View Article
Florida produce sees opportunity with non-renewal of USMCA
View Article
Heightened Chinese Coast Guard patrols in Taiwan Strait may impact East Asia shipping
View Article“K” LINE to support relief efforts following earthquake off the Coast of Mindanao
The earthquake that struck off the coast of Mindanao, the Philippines, on June 8 caused severe damage in a number of regions.
View ArticleGet the most up-to-date trending news!
SubscribeIndustry updates and weekly newsletter direct to your inbox!
Follow us on social media:
![]()
![]()


