U.S. shipments of solar photovoltaic modules increase as prices continue to fall
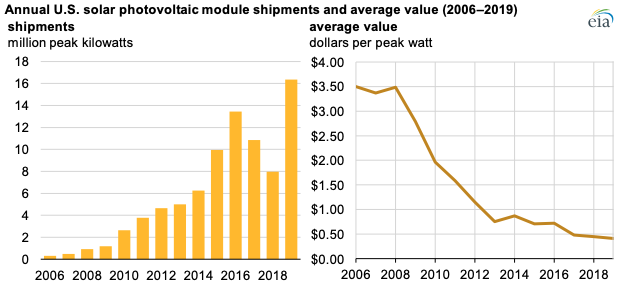
Aug 19, 2020In 2019, U.S. shipments of solar photovoltaic (PV) modules, also referred to as solar panels, reached a record-high 16.4 million kilowatts (kW), 2.9 million kW more than the previous record of 13.5 million kW set in 2016. Solar PV module shipments include imports, exports, and modules produced and sold domestically, but they exclude modules shipped for resale. These shipments have steadily increased since 2006, driven by significant price declines and policy incentives that encourage solar PV installation. U.S. PV shipments declined in 2017 and 2018 when policy reforms and import tariffs went into effect.

The cost of PV modules has declined significantly since 2006, helping drive the growth of solar module shipments. The average value of solar PV module shipments, a proxy for price, decreased from $3.50 per peak watt in 2006 to $0.40 per peak watt in 2019. In the U.S. Energy Information Administration’s (EIA) annual PV shipments report, average values and shipments are reported in terms of peak watts, which reflect the power output under full solar radiation.
Higher module efficiency, greater labor productivity, and lower supply chain costs are largely responsible for the declines in the average value of solar PV modules. Recent declines in the price of modules and components that started in mid-2016 are related, in part, to both global oversupply resulting from decreased demand in China and increased cost-competitiveness within the industry.
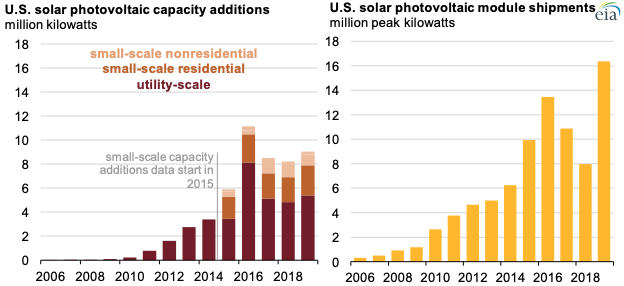
Because the United States exports few modules, solar PV module shipments generally track domestic PV capacity additions; differences between the two are usually attributed to timing between shipping and installing. EIA categorizes PV capacity additions as utility-scale additions, which include facilities with a capacity of one megawatt (MW) or more, and small-scale additions, which are largely residential solar installations.

In 2019, residential solar PV installations totaled more than 2.5 gigawatts (GW). This increase is partially a result of homeowner incentives for installing solar arrays, such as the California Solar Initiative and the New York Megawatt Block program, as well as other state-level policies and incentives.
Although solar shipments have seen an upward trend, growth was interrupted in 2017 and 2018. In 2017, residential installations decreased as a result of state-level net metering policy changes, fewer state-level incentives, and changes in the business strategies of some of the top national solar installers.
In 2018, solar PV module shipments recorded the fewest shipments since 2014, largely as a result of new tariffs. Effective February 7, 2018, the U.S. government placed tariffs on imported solar cells and modules, starting at a 30% tariff rate and decreasing five percentage points each subsequent year for four years.

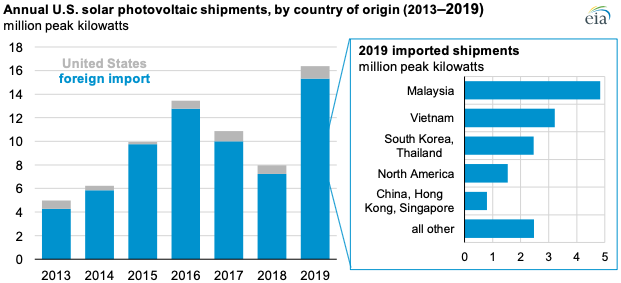
In 2019, imports accounted for 94% of total solar PV shipments. Anti-dumping tariffs imposed on solar products from China and Taiwan in 2012 and 2014 led some solar PV manufacturers located in the two countries to outsource their production to countries not covered by the anti-dumping duties.
Malaysia has attracted a number of solar panel companies looking to offshore their panel production, including some Chinese and Taiwanese firms as well as American, German, South Korean, and Japanese companies. Malaysia is now one of the world’s largest solar panel producers, and it was the leading country of origin for U.S. solar panel imports in 2019, with 4.8 million peak kW shipped.
Principal contributor: Lolita Jamison
Similar Stories

Greater New Orleans, Inc. celebrates passage of Constitutional Amendment 1
View Article
AVAT and KBB are going to cooperate in the digitalization of turbochargers
View Article
Drought conditions reduce hydropower generation, particularly in the Pacific Northwest
View Article
Milestone achieved: over 10 million tons of CO2 emissions reduced by Corvus Energy marine battery systems
View Article
U.S. fuel ethanol exports rise on strong international demand and low U.S. prices
View ArticleLow carbon fuels in the spotlight as California’s Air Board and Energy Commission set to review policies and update guidance
Fuel prices and continued progress on greenhouse gas emissions at stake
View ArticleGet the most up-to-date trending news!
SubscribeIndustry updates and weekly newsletter direct to your inbox!


