Ocean Insights data indicates heavy September traffic at container transshipment ports
Oct 15, 2020
Supply chain disruption due to container rollovers at leading transshipment ports eased marginally for shippers in September compared to August. However, the ratio of rollovers remained far higher compared to a year earlier at most hubs, according to Ocean Insights, the world’s leading real-time and predictive ocean container tracking data provider to forwarders and shippers.
The latest global container port rollover findings were compiled by analyzing Ocean Insights’ proprietary global container tracking data through to the end of September.
The results revealed that in most leading container shipping hubs between a fifth and a third of transshipment cargo was subject to rollovers, adding to the supply chain disruption experienced by shippers in many parts of the world due to capacity and equipment shortages.
“Container lines were taken by surprise by the surge in demand for shipments as coronavirus lockdowns were eased during the summer,” said Josh Brazil, Chief Operations Officer at Ocean insights.
“Schedules are clearly still suffering significant disruption and, in many ports, this is being exacerbated by equipment shortages which are adding to rate inflation and logistics bottlenecks and inefficiencies.
“As a result, carriers are frequently rolling cargo, which can result in significant delays and knock-on costs for customers, especially if they are not notified by the line in advance, which customers tell us is quite common.
“Early indications in October suggest supply chain disruptions and significant rollovers will continue deep into the fourth quarter as peak season demand continues to surprise.”
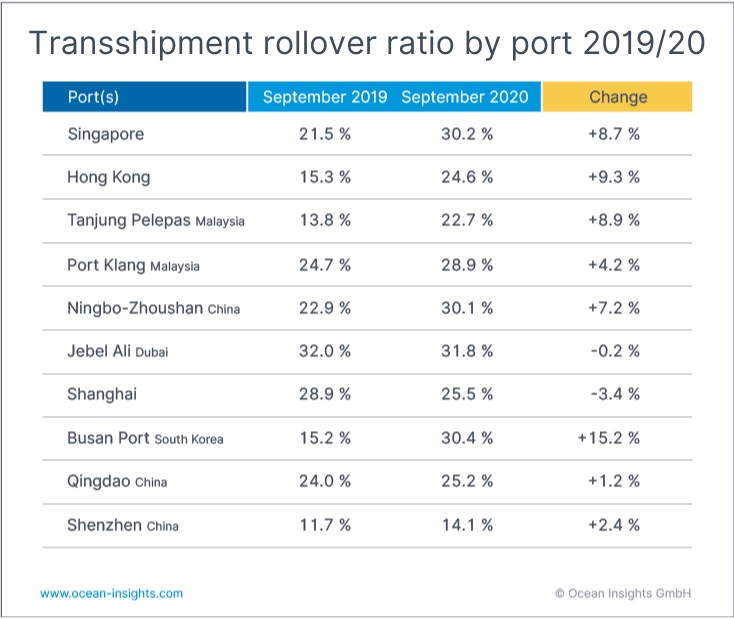
Singapore, the world’s second largest container hub, saw rollovers, calculated by Ocean Insights as the percentage of cargo arriving at the port for transshipment that was shipped on a different vessel than originally scheduled, drop from 33.3% in August to 30.2% last month. This, compared to just 21.5% of cargo rolled over in September 2019.
24.6% of cargo was rolled at the port of Hong Kong’s various terminals last month, down from 32.2% in August but still significantly more disruptive when compared to September 2019 when just 15.3% of cargo was affected.
Malaysia’s Port of Tanjung Pelepas saw 22.7% of box traffic received last month rolled over compared to 29.2% in August and 13.8% in September 2019, while Port Klang saw 28.9% of cargo rolled last month compared to 42.3% in August and 24.7% in September 2019.
At Ningbo-Zhoushan, the world’s third largest container port in 2019 by throughput, 30.1% of cargo was rolled last month, down from 43% in August, while Dubai (Jebel Ali port) saw rollovers drop to 31.8% in September from 34.9% in August.
Shanghai, the world’s largest container port, saw rollovers decline to 25.5% last month from 26.5% in August. However, performance improved when compared to September 2019 when 28.9% of cargo transshipped at the port’s multitude of terminals was rolled over.
Some of the world’s leading box hubs also reported a deterioration in carrier adherence to schedules last month.
Busan Port, the world’s sixth largest box hub in 2019, saw cargo rollovers increase to 30.4% in September, up from 28% in August and just 15.2% in September 2019. At the port of Qingdao container rollovers spiked to 25.2% in September compared to just 13% the previous month, while Shenzhen, one of the best port performers in terms of rollover ratios, saw just 14.1% of cargo rolled over last month, up from 9.4% in August and 11.7% in September 2019.
Rollover Ratios by Leading Container Lines
The large majority of the leading container lines improved their monthly rollover performance in September. Ocean Insights calculates the rollover ratio for carriers as the percentage of cargo carried by each line globally that left a transshipment port on a different vessel than originally scheduled. Last month, the leading lines collectively saw rollovers recede last to 26.9% compared to 30.7% in August.
MSC’s rollover ratio fell to 16.2% in September from 18.2% in August. Maersk’s rollover ratio was 32.9% in September compared to 37.5% in August. Hapag-Lloyd’s rollover ratio in September was 34.2% (38.4% in August); CMA CGM’s was 40.6% (45.8%); COSCO’s was 23.7% (30.1%); and Evergreen’s was 25.9% (28.4%).
ONE bucked the improving trend, however. Rollovers on its services increased from 35.8% in August to 38.9% last month. https://www.ocean-insights.com/
Similar Stories

Cuxport enhances operations with new terminal operating system from Kaleris
View Article
NAWE issues statement on Master Contract tentative deal
View Article
UIPA incentive supports Nucor Towers & Structures expansion in Brigham City
View Article
NRF praises tentative labor deal for East Coast, Gulf Coast ports
View Article
Hyster to provide electric empty container handler at Malta Freeport Terminals
View Article
Consolidated Chassis Management expands leadership team with four key hires
View ArticleGet the most up-to-date trending news!
SubscribeIndustry updates and weekly newsletter direct to your inbox!


