No volume decline in January & consequences of market volatility according to WorldACD Market Data
Feb 19, 2021This month, we start with an important observation for our industry: worldwide volumes in January 2021 were the same as in January 2020, making January the first month since the start of the pandemic not showing a decline year-on-year (YoY). Although worldwide rates per kg were 75% higher YoY, they were 8% lower than those in December. The worldwide load factor dropped by 2% pts month-over-month (MoM) but increased by 17% pts YoY, thanks to a drop in capacity of 28% pts (excluding integrators). The load factors on wide-body freighters gained 7% pts YoY, while wide-body passenger aircraft booked an increase of 22% pts.
The outstanding performers in January were virtually all to be found in the Asia Pacific region, which has indeed recovered quickest from the consequences of the pandemic. The area as a whole improved by 12% YoY outgoing and 14% incoming. The origins Vietnam and Japan each increased their outgoing volumes by more than 30%, closely followed by Taiwan (+25%). Outside Asia, only the United States managed to improve its performance as an air cargo origin (+3% YoY), with the Midwest as the main engine of growth (+13%). A striking feature of the North American market was the fact that incoming business from Europe showed the highest YoY rate increase of all major markets: +147%.
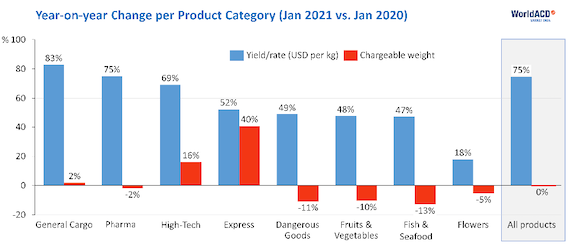
Express, High Tech and General Cargo were the product categories showing YoY volume increase (Express was 40% up). In terms of changes in USD-rates, we noted increases varying from +18% for flowers to +83% for general cargo (see also chart below).

Taking a closer look at January, we should not overlook the fact that Chinese New Year (CNY) was in January last year, and in February this year. Even though there usually is a flurry of activity from Asia just before CNY, the whole period as a rule shows a dip. Yet, this year the January-volumes ex China and Hong Kong were 93% of the top-month of November; a year ago, that figure stood at 77% only.
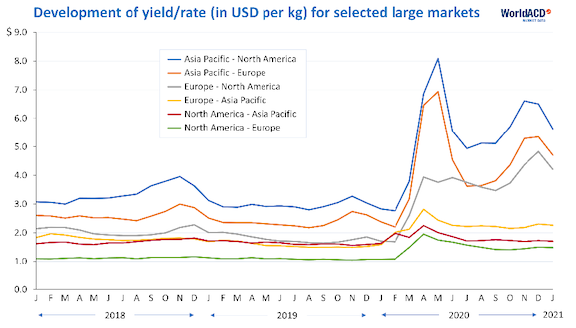
Over a longer period of time, yields/rates (in USD) developed as follows:

Consequences of Market Volatility
Since about a year, the increased volatility in air cargo markets has also increased the appetite of many in our business for getting the most recent information. At the same time, ongoing digitisation has created new platforms, each covering (often small) subsets of the overall market. This has caused a proliferation of new data providers. They tell us – often on a weekly basis – how markets behave, how volumes and load factors change, what happens on a particular lane, how an index moves, etc. COVID-19 has changed the air cargo world, and that world is unlikely to change back to the “old normal”.
What has not yet changed, however, is the fact that it takes time for companies active in air cargo, to assemble, validate and finalize all information about their shipments, be they airline, forwarder or shipper. This has consequences for data quality: (i) the quicker data are made available, the more provisional their nature, and (ii) the smaller the basis on which they are built, the less representative they are as an indicator for the market as a whole. No weekly data service can escape this logic, however much we all would like to combine speed with accuracy & completeness.
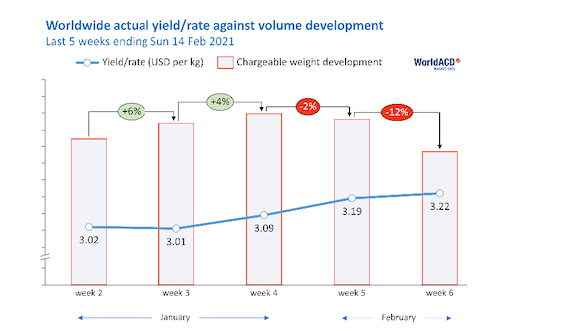
At WorldACD, we will continue improving our weekly data, knowing very well their provisional character, which makes them a precursor to our monthly data. Having said that, when we put in our “two cents” for the first two weeks of February, we see that both volumes and capacity decrease, particularly from Asia Pacific (CNY!), while rates continue their upward trend that started in the last part of January.

Similar Stories

A flying start to 2025 but after 14 months of double-digit demand growth, air cargo stakeholders remain cautious
View ArticlePharma.Aero expands global network with six key new members
CEVA Logistics, Skandi Network, SCL Cold Chain, Shipex NV, Pharming Group, and ARTBIO join the life sciences logistics collaborative platform
View Article
Chapman Freeborn appoints Bolton-Wilson VP Humanitarian and Government
View Article
Alleima supplies Preem in the green transition of the aviation industry
View Article
Airforwarders Association new board member King elected
View Article
Air India extends SATS and WFS partnership with 14 new cargo and ground handling contracts across global network
View ArticleGet the most up-to-date trending news!
SubscribeIndustry updates and weekly newsletter direct to your inbox!


