FIS Air Freight Report September 1, 2020
Sep 02, 2020Price Comment
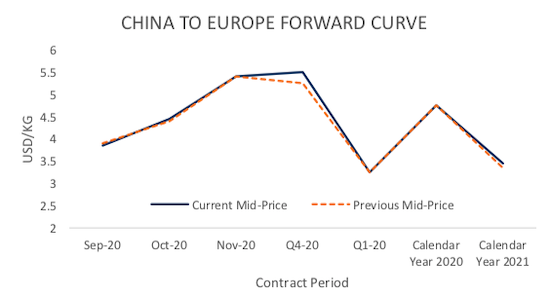
Export prices kick back into action on the last week of August, despite many seeing a lull in actual moved volumes until mid-September. Prices remain consistent with last weeks forward curves, September 2020 corrects downward 5 cents along China to Europe, and upwards 7 cents from China to USA. Spreads widen dramatically on the China to USA route, considering high offers of $7.50/kg for November 2020. The same is seen from China to USA, with a desired low of $4.00/kg clashing to offers topping out at the $6.80/kg level for November 2020. Quite a bit of capacity is already booked out, leaving little in terms of free capacity for Q4 whilst many double-down on cold-chain infrastructure and pharma solutions in prepation for COVID-19 vaccine shipments.
TAC Index Pricing
| Route | USD/KG | Change | Change % | MTD | VOL |
| China to Europe | 3.32 | 0.14 | 4.40% | 3.32 | 94.68% |
| China to USA | 5.33 | 0.43 | 8.78% | 5.33 | 87.86% |
| Shanghai to Europe | 3.6 | 0.35 | 10.77% | 3.6 | 119.35% |
| Shanghai to USA | 5.35 | 0.83 | 18.36% | 5.35 | 78.16% |
| Hong Kong to Europe | 3.04 | -0.08 | -2.56% | 3.04 | 112.89% |
| Hong Kong to USA | 5.3 | 0.03 | 0.57% | 5.3 | 93.10% |
| Chicago to Europe | 1.52 | -0.16 | -9.52% | 1.52 | 133.34% |
| Frankfurt to USA | 3.72 | -0.38 | -9.27% | 3.72 | 187.05% |

Market Comment
A new month, however the same news - the near term market perks up in terms of price movements, with a few notable exceptions and a continual erosion of east-bound trans-Atlantic rates. Most counter parties still give us a sense that the market will be slack until mid-September.
There is quite a lot of action, and quite a bit more talk, about preparation for the as-of-yet elusive COVID-19 vaccine cargoes, with a number of carriers and forwarders putting emphasis on bolstering cold-chain and pharmaceutical infrastructure. From our perspective, the feedback has been that airlines are largely booked out (or at least booked out for everything they don’t want on free sale) for Q4.
This could be concerning for those left out of owning capacity, equally this presents a forward price risk should the market move the wrong direction for either capacity buyers and sellers. The vast majority of hedging interest has been either to lock-in Q4 prices against any nasty surprises - or more significantly to establish a categorical baseline air freight price for 2021 and even 2022 (something that doesn’t appear at least, to be practically achievable without Air FFAs).
Air FFA Forward Pricing Curves
| FIS Air FFA, China to Europe | USD/KG | ||||
| Month | Bid | Offer | MID | Change |
| Sep-20 | 3.30 | 4.40 | 3.85 | 0.05 |
| Oct-20 | 3.80 | 5.10 | 4.45 | 0.05 |
| Nov-20 | 4.00 | 6.80 | 5.40 | 0.00 |
| Q4-20 | 4.00 | 7.00 | 5.50 | 0.25 |
| Q1-20 | 2.90 | 3.60 | 3.25 | 0.00 |
| Calendar Year 2020 | 4.00 | 5.50 | 4.75 | 0.00 |
| Calendar Year 2021 | 2.80 | 4.10 | 3.45 | 0.10 |

| FIS Air FFA, China to USA | USD/KG | ||||
| Month | Bid | Offer | MID | Change |
| Sep-20 | 4.90 | 6.10 | 5.50 | 0.07 |
| Oct-20 | 5.00 | 6.80 | 5.90 | 0.10 |
| Nov-20 | 5.20 | 7.50 | 6.35 | 0.00 |
| Q4-20 | 4.90 | 7.50 | 6.20 | 0.05 |
| Q1-20 | 3.50 | 4.90 | 4.20 | 0.00 |
| Calendar Year 2020 | 4.00 | 6.80 | 5.40 | 0.00 |
| Calendar Year 2021 | 3.20 | 5.10 | 4.15 | 0.05 |

Similar Stories
BTS to will begin releasing preliminary estimates of airline passenger travel in 2025
Monthly passenger enplanement numbers are not reported by the carriers and published by BTS for the month until more than a month later. BTS developed a model, which uses a…
View Article
Ambercor Shipping participated in air charter transport from Canada to Australia
View ArticleCass Information Systems acquires AcuAudit Platform from Acuitive Solutions
Cass Information Systems, Inc. (Cass), the leading global provider of freight audit & payment solutions, has acquired AcuAudit, the premier freight audit platform for ocean and international air freight, from…
View ArticleLos Angeles Industrial CRE Market Update – 4th qtr. 2024
TEU and airfreight numbers continue to improve, but excess capacity has muted any genuine change to the state of the leasing market.
View Article
CPaT announces new major partnership with “Saudia Academy”
View Article[Freightos Weekly Update] Mexico increases trade barriers for Chinese imports
Ocean rates out of Asia overall trended up slightly to end the year, but with Lunar New Year approaching and a range of January transpacific GRIs announced, prices could face…
View ArticleGet the most up-to-date trending news!
SubscribeIndustry updates and weekly newsletter direct to your inbox!


