February 2026 U.S. airline traffic data up 1.5% from the same month last year
May 08, 2026February 2026 U.S. Airline Traffic Data Up 1.5% from the Same Month Last Year
This release is published on a fixed schedule as required by the Office of Management and Budget, and statistics in this release may be revised when inputs to the statistics are corrected or updated. Data on the program page of this website are the most up-to-date and complete.

U.S. airlines carried 68.2 million systemwide (domestic and international) scheduled service passengers in February 2026, according to the Bureau of Transportation Statistics (BTS). When adjusted for seasonality, February enplanements are up 1.4% from January and down 2.1% from the all-time high reached in June 2024.
BTS reported 59.2 million domestic passengers and 9 million international passengers on U.S. airlines flights in February, not adjusting for seasonality.
U.S. airline traffic reports are filed monthly with BTS. See the tables that accompany this release on the BTS website for summary data since 2016 (Tables 1-24) and complete data since 2000.
Trends (not seasonally adjusted) in U.S. airlines passenger enplanements
February unadjusted
- Systemwide enplanements (68.2M) were down 3.1% from the all-time February high (70.4) reached in 2024.
- Domestic enplanements (59.2M) were down 3.0% from the all-time February high (61.0) reached in 2024.
- International enplanements (9.03M) were down 3.9% from the all-time February high (9.4) reached in 2024.
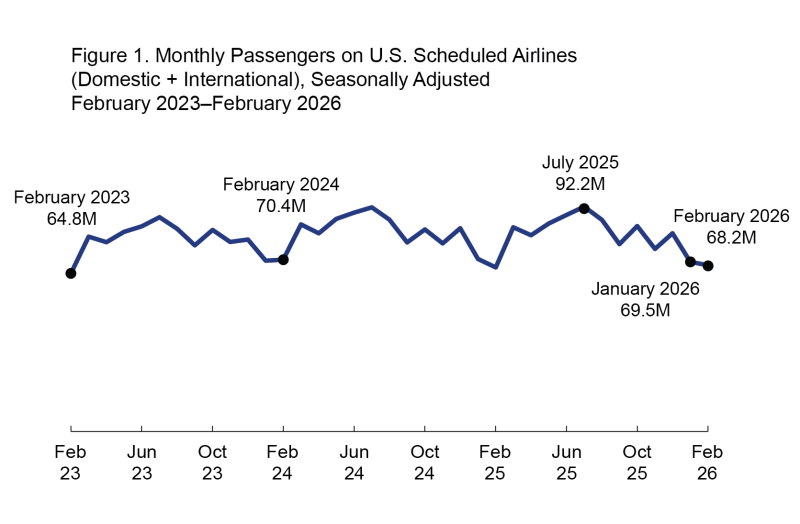 |
Table A. Unadjusted Passenger Enplanements Compared to Previous Time Periods
Unadjusted | Passengers | Percent Change Compared to | ||
Previous | Two Years | Three Years | ||
February | 68.2 | 1.5% | -3.1% | 5.2% |
Seasonally adjusted trends in U.S. airlines passenger enplanements
February seasonally adjusted
- Systemwide enplanements (81.6M) were down 2.1% from the all-time high of 83.3 million reached in June 2024.
- Domestic enplanements (70.6M) were down 2.4% from the all-time high of 72.4 million reached in June 2024.
- International enplanements (10.94M) were down 1.5% from the all-time high of 11.1 million reached in December 2024.
Table B. Seasonally Adjusted Passenger Enplanements Compared to Previous Time Periods
Seasonally | Passengers | Percent Change Compared to | ||
Previous | Previous | Three Years | ||
February | 81.6 | 1.4% | 1.3% | 4.4% |
For data filed through February, see accompanying tables. For the complete database of reported data, see Traffic. For an explanation of BTS’ seasonal adjustment methodology, see Seasonal Adjustment.
Reporting Notes
Data are compiled from monthly reports filed with BTS by commercial U.S. air carriers detailing operations, passenger traffic and freight traffic. This release includes data received by BTS from 77 U.S. carriers as of May 5 for U.S. carrier scheduled civilian operations.
See the BTS Airlines and Airports page for additional scheduled service numbers through February for U.S. airlines. International data by origin and destination is available through November. International totals in this press release consist of all U.S. carrier operations to and from the U.S. and from one foreign point to another foreign point. BTS’ Airlines and Airports page does not include U.S. carriers’ foreign point-to-point flights.
BTS has scheduled June 11, 2026 for the release of data through March.
None of the data are from samples. Measures of statistical significance do not apply to the complete air traffic data.
BTS separately releases preliminary enplanement estimates. Unlike the monthly air traffic releases, which are calculated from U.S. carrier scheduled civilian operations, the preliminary estimates are forecasted from data including all carriers and unscheduled service, with a total estimate of 78.8M passengers for February 2026. Using only the U.S. carrier scheduled service figures, BTS’ preliminary estimates for February were 70.5M passengers, which was over 98% accurate.
To receive updates from BTS directly to your email, please consider subscribing to our GovDelivery service.
Similar Stories

CN delivers on commitments with strong second quarter results
View Article
FL Technics appoints Saulius Bajarunas as Chief Executive Officer
View Article
Chicago Rockford International Airport strengthens Asian network with new DSV Incheon service
View Article
Avianca Cargo and DSV transport 58 tons of humanitarian aid to Venezuela
View Article
National Airlines orders more GE Aerospace CF6 and GE90 engines
View Article
Turkish Airlines joins SAFFA Fund
View ArticleGet the most up-to-date trending news!
SubscribeIndustry updates and weekly newsletter direct to your inbox!
Follow us on social media:
![]()
![]()


