
EIA releases new US energy atlas with updated maps and enhanced navigation
Jan 04, 2021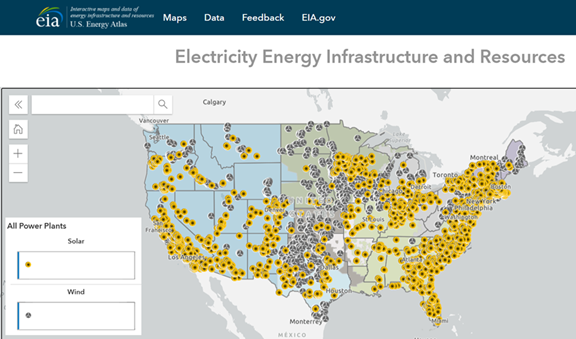
Today, the U.S. Energy Information Administration (EIA) released the U.S. Energy Atlas, a new interface for web map applications and a comprehensive open data catalogue. The U.S. Energy Atlas shows detailed energy infrastructure in redesigned maps with enhanced navigation and data accessibility features. With the U.S. Energy Atlas, users can now combine EIA’s data with information from other sources to customize their own geospatial analysis.
The U.S. Energy Atlas features 84 map layers, 60 of which are based on EIA surveys. EIA data published in the U.S. Energy Atlas include locations of power plants, coal mines, oil and natural gas wells, pipelines, storage facilities, natural gas processing plants, refineries, and other types of energy facilities.
The U.S. Energy Atlas also includes information from non-EIA sources, such as the Federal Energy Regulatory Commission, the U.S. Geological Survey, the U.S. Bureau of Ocean Energy Management, and the National Oceanic and Atmospheric Administration. Like EIA’s former mapping platform, the U.S. Energy Atlas also uses Homeland Infrastructure Foundation-Level Data: public domain information used to support community preparedness, resiliency, and research.
The U.S. Energy Atlas incorporates many new features, most notably access to new web map applications such as new energy infrastructure maps, disruptions maps, and an open data catalogue. Users can download entire datasets or filtered subsets in a variety of data formats, including shapefile, KML file, geodatabase file, and spreadsheet. Previously, EIA provided these datasets only in shapefile format.
The U.S. Energy Atlas provides the public, policymakers, analysts, and other stakeholders with access to useful energy infrastructure information through open source data and interactive web map applications. For example, when natural disasters such as hurricanes, tropical storms, or wildfires form, these customized maps help users see what key energy infrastructure elements could be affected.
Similar Stories

OOCL Wisdom completes first green methanol bunkering and commences maiden voyage at Qingdao Port
View Article
bound4blue eases eSAIL® adoption with ABS review of Pwind calculation methodology
View Article
A mobile green hydrogen refueling station enables the immediate deployment of a hydrogen bus fleet in Northern Germany
View Article
U.S. refinery capacity has dropped from 2025 to 2026
View Article
Svanehoj to supply LTD gauging systems for an LNGC-to-FSU conversion
View Article
TGP appoints Igor Muñiz as Chief Strategy Officer
View ArticleGet the most up-to-date trending news!
SubscribeIndustry updates and weekly newsletter direct to your inbox!
Follow us on social media:


