December 2019 Freight Transportation Services Index (TSI)
Feb 12, 2020
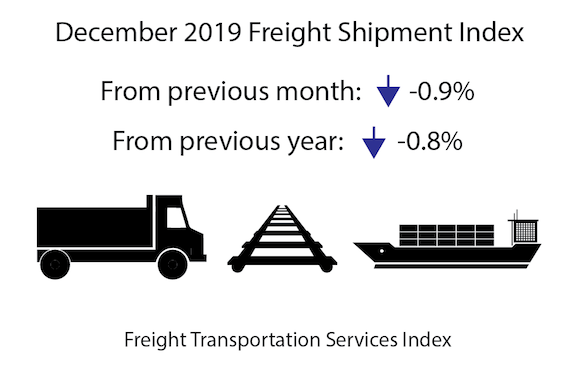
The Freight Transportation Services Index (TSI), which is based on the amount of freight carried by the for-hire transportation industry, fell 0.9% in December from November, falling for the second consecutive month to its lowest level since August 2018, according to the U.S. Department of Transportation’s Bureau of Transportation Statistics (BTS).
For the year, the index fell 0.8% from December 2018 to December 2019, the first annual decline since 2015. The decline in 2019 followed a rise of 2.9% from December 2017 to December 2018 (Tables 1, 2, and 2A).
In the fourth quarter of 2019, the freight TSI fell 1.0%, the second consecutive quarterly decline. It was the largest decline in any quarter since the fourth quarter of 2015 when the index fell 2.2% (Table 10).

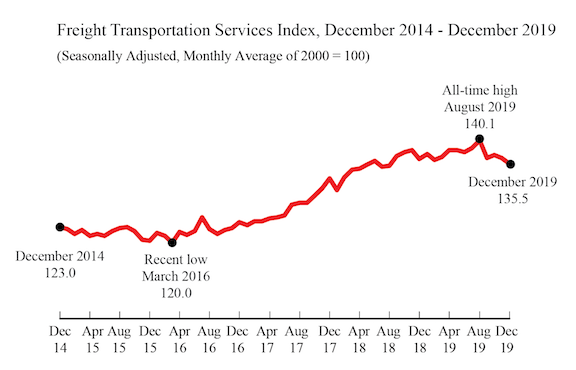
The level of for-hire freight shipments in December measured by the Freight TSI (135.5) has declined 3.3% since reaching the all-time high level of 140.1 in August 2019 (Table 2A). BTS’ TSI records begin in 2000. See historical TSI data.
The November index was revised down to 136.7 from 137.4 in last month’s release. Monthly numbers for August and October were revised down slightly. June was revised up slightly.
The Freight TSI measures the month-to-month changes in for-hire freight shipments by mode of transportation in tons and ton-miles, which are combined into one index. The index measures the output of the for-hire freight transportation industry and consists of data from for-hire trucking, rail, inland waterways, pipelines and air freight. The TSI is seasonally-adjusted to remove seasonality from month-to-month comparisons.
Analysis: The Freight TSI September decrease of 0.9% reflected significant declines in
in rail intermodal, rail carloads, trucking, and pipeline, while water and air freight increased. The TSI decline took place against a background of mixed results in other indicators. The Federal Reserve Board Industrial Production Index declined 0.3% in December reflecting a substantial decrease in utilities and increases in mining and manufacturing. Housing starts grew by 16.9%. The Institute for Supply Management Manufacturing index decreased 0.9 points to 47.2, indicating contraction in manufacturing for the fifth consecutive month. The ISM manufacturing index is based on a survey of 800 supply chain executives on production, orders, deliveries, and employment, while the Federal Reserve IP index is based on estimated physical output using a range of output measures that the Federal Reserve considers reliable. Comparisons between patterns in the ISM manufacturing and the Federal Reserve IP index should be done with caution.
Trend: The Freight Index’s 0.9% decline in December, was the second decline in a row and the third decline in fourth months for a total decrease of 3.3% from the high of 140.1 in August 2019. This decline left the index at its lowest level since August 2018. However, it remained above any level it had reached before the high of June 2018. In effect, the Freight TSI rose 13.5% from March 2016 to June 2018, but has been essentially stable (declining by 0.5%) since then.
The 1.0% decrease in the fourth quarter of 2019, was the second consecutive quarterly decline and the third in the last five quarters. It was the largest quarterly decline since the fourth quarter of 2015. The index has increased in 10 of 13 quarters since the fourth quarter of 2016.
The September index was 42.9% above the April 2009 low during the most recent recession. For additional historical data, go to TSI data.
Index highs and lows: For-hire freight shipments in December 2019 (135.5) were 42.9% higher than the low in April 2009 during the recession (94.8). The December 2019 level was 3.3% below the historic peak reached in August 2019 (140.1).
Annual: For-hire freight shipments measured by the index were down 0.8% in December compared to the end of 2018 (Table 3).
Long-term trend: For-hire freight shipments are up 10.2% in the five years from December 2014 and are up 33.2% in the 10 years from December 2009 (Table 5).
Same month of previous year: December 2019 for-hire freight shipments were down 0.8% from December 2018 (Tables 4, 5).
The TSI has three seasonally adjusted indexes that measure changes from the monthly average of the base year of 2000. The three indexes are freight shipments, passenger travel and a combined measure that merges the freight and passenger indexes. See Seasonally-Adjusted Transportation Data for numbers for individual modes. TSI includes data from 2000 to the present. Release of the January 2020 index is scheduled for March 11.
Passenger Index: The TSI for passengers rose 0.3% in December from its November level (Table 6). The Passenger TSI December 2019 level of 134.6 was 3.5% above the December 2018 level (Table 7). The index is up 12.3% in five years and up 22.7% in 10 years (Table 5). The passenger TSI measures the month-to-month changes in travel that involves the services of the for-hire passenger transportation sector. The seasonally adjusted index consists of data from air, local transit and intercity rail.
Combined Index: The combined freight and passenger TSI fell 0.4% in December from its November level (Table 8). The combined TSI December 2019 level of 134.9 was 0.8% above the December 2018 level (Table 9). The combined index is up 10.9% in five years and up 30.0% in 10 years (Table 5). The combined TSI merges the freight and passenger indexes into a single index.
Revisions: Monthly data has changed from previous releases due to the use of concurrent seasonal analysis, which results in seasonal analysis factors changing as new data are added.
Similar Stories
FlexiVan appoints new Chief Commercial Officer and new Chief Operating Officer
Flexi-Van Leasing, LLC (FlexiVan) announces the appointment of Chadwick (Chad) Heller, as its new Chief Commercial Officer, and Keith Saunders, as its new Chief Operating Officer.
View ArticleINVESTING IN AMERICA: Biden-Harris Administration announces $635 Million to continue expanding zero-emission EV charging and refueling infrastructure
New investments from the Bipartisan Infrastructure Law will add more than 11,500 electric vehicle charging ports and expand hydrogen and natural gas fueling infrastructure in communities nationwide
View Article
Castor Marine becomes part of the Navarino Group
View Article
OOCL announces operational update for the 4th Quarter 2024
View Article
Averitt opens new Dothan, AL service center
View Article
MSC Announcement: Multiple shipping updates
View ArticleGet the most up-to-date trending news!
SubscribeIndustry updates and weekly newsletter direct to your inbox!


