August 2024 U.S. Transportation Sector Unemployment (4.8%) Falls Below the August 2023 Level
Sep 06, 2024August 2024 U.S. Transportation Sector Unemployment (4.8%) Falls Below the August 2023 Level (4.9%) And Hits Same Level as the Pre-Pandemic August 2019 Level (4.8%)
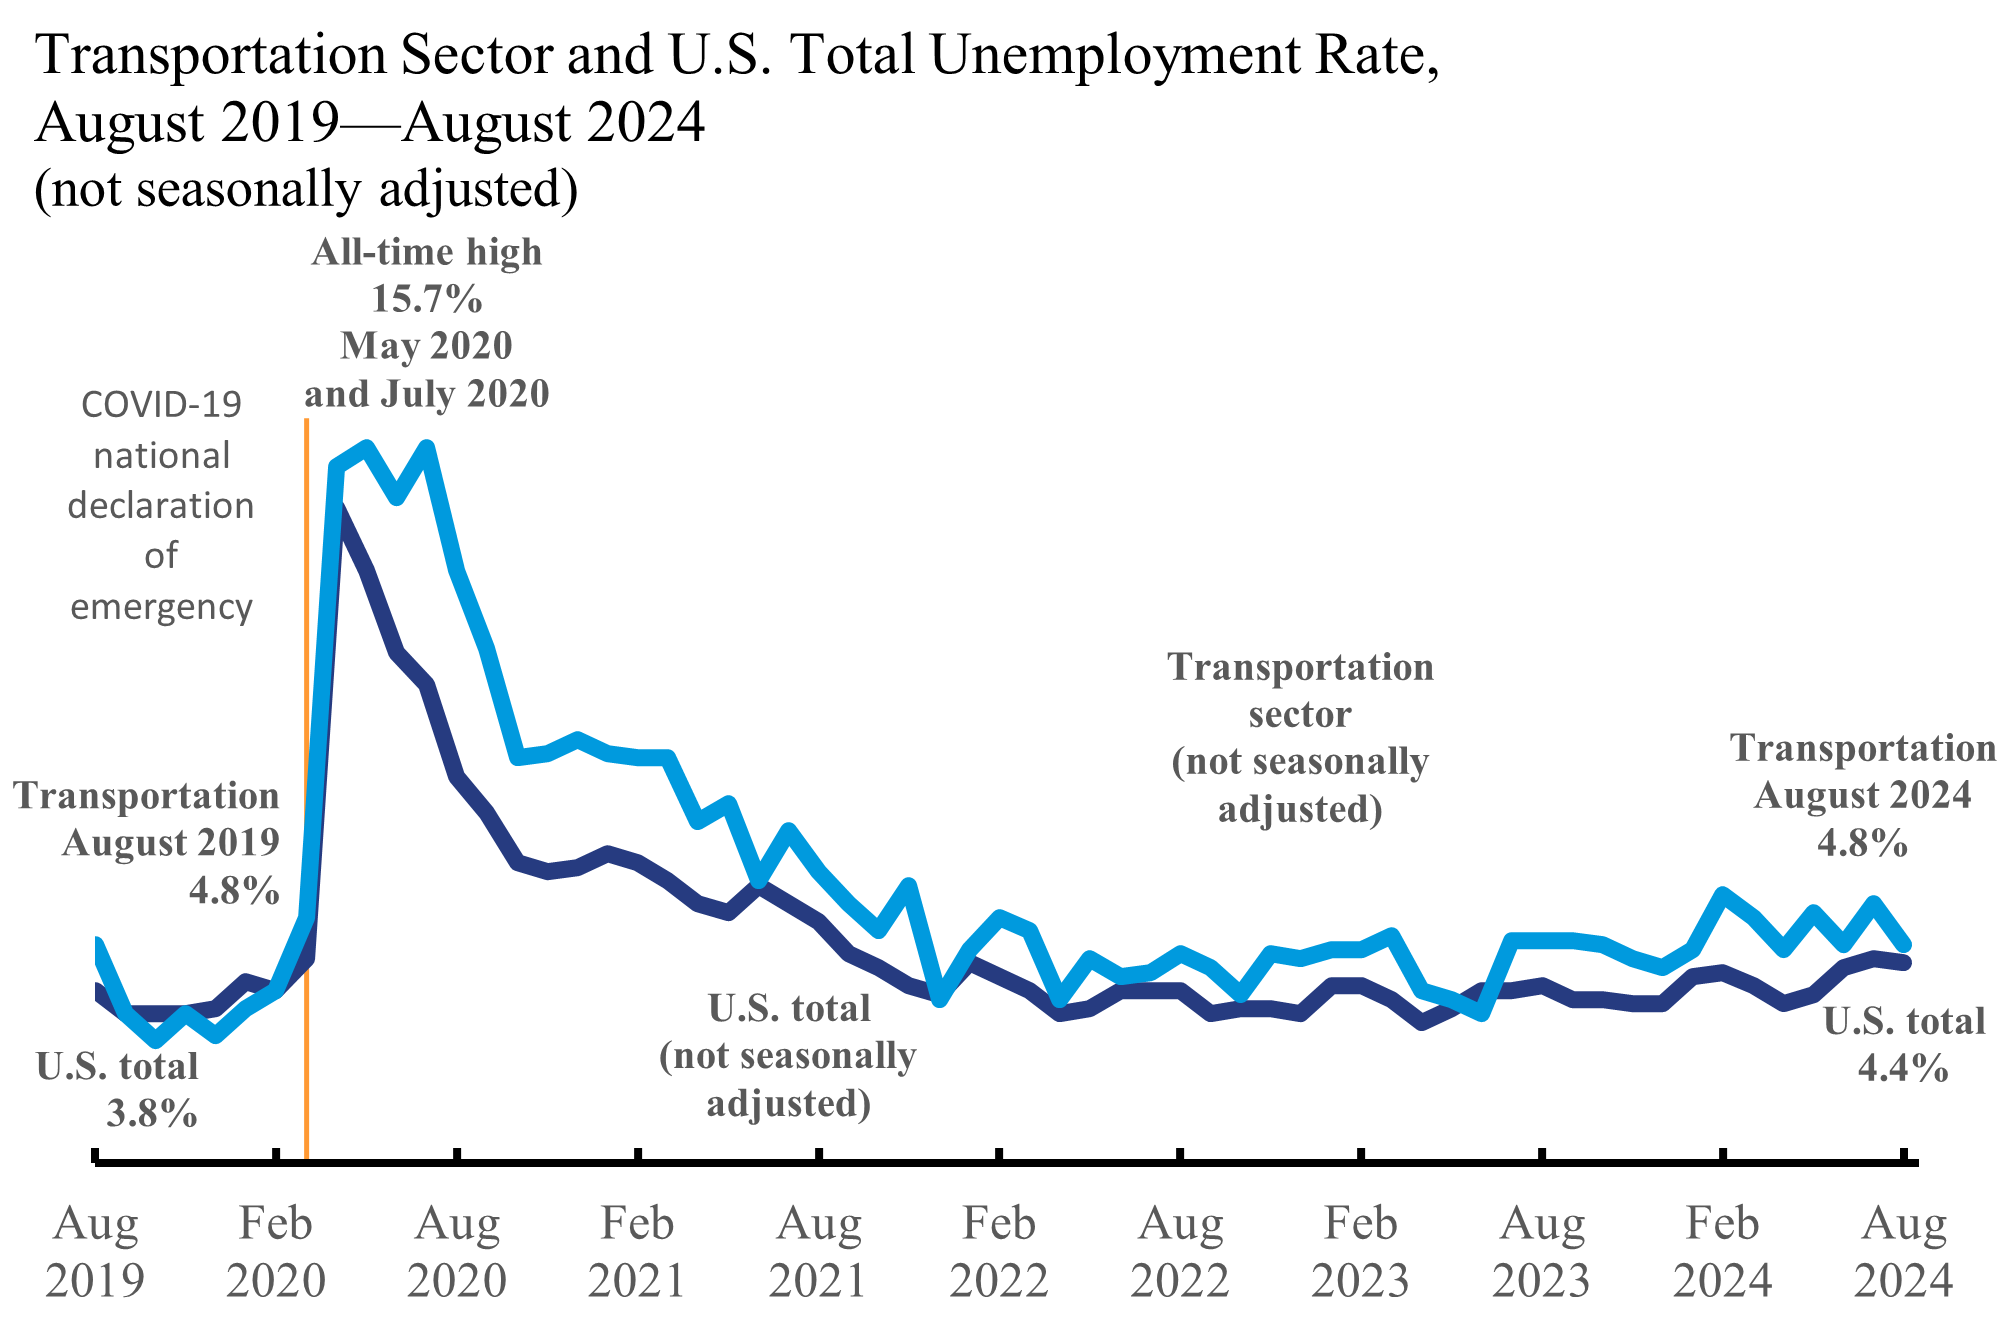
The unemployment rate in the U.S. transportation sector was 4.8% (not seasonally adjusted) in August 2024 according to the Bureau of Labor Statistics (BLS). These data have been updated on the Bureau of Transportation Statistics’ (BTS) Unemployment in Transportation dashboard. In August 2024, the transportation sector unemployment rate fell 0.1 percentage points from 4.9% in August 2023 and was the same as the pre-pandemic August 2019 level of 4.8%. Unemployment in the transportation sector reached its highest level during the COVID-19 pandemic (15.7%) in May 2020 and July 2020.
Unemployment in the transportation sector was higher than overall unemployment. BLS reports that the U.S. unemployment rate, not seasonally adjusted, in August 2024 was 4.4% or 0.4 percentage points below the transportation sector rate. Seasonally adjusted, the U.S. unemployment rate in August 2024 was 4.2%.
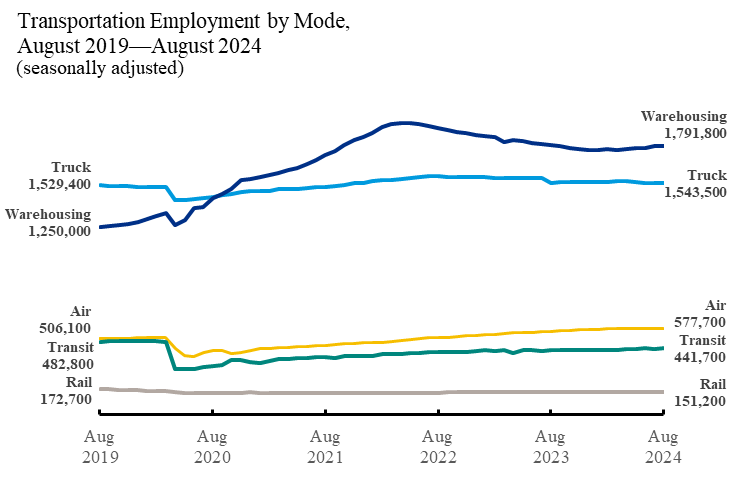
Seasonally adjusted, employment in the transportation and warehousing sector rose to 6,624,400 in August 2024 — up 0.1% from the previous month and up 1.2% from August 2023. Employment in transportation and warehousing grew 16.3% in August 2024 from the pre-pandemic August 2019 level of 5,695,800. By mode (seasonally adjusted):
- Air transportation rose to 577,700 in August 2024 — up 0.4% from the previous month and up 4.0% from August 2023.
- Truck transportation fell to 1,543,500 in August 2024 — down 0.1% from the previous month but remained unchanged from August 2023.
- Transit and ground passenger transportation rose to 441,700 in August 2024 — up 1.0% from the previous month and up 2.4% from August 2023.
- Rail transportation remained virtually unchanged in August 2024 at 151,200 from the previous month but down 1.2% from August 2023.
- Water transportation fell to 73,700 in August 2024 — down 1.7% from the previous month but up 3.9% from August 2023.
- Pipeline transportation fell to 53,300 in August 2024 — down 2.4% from the previous month but up 2.7% from August 2023.
- Warehousing and storage rose to 1,791,800 in August 2024 — up 0.2% from the previous month but down 0.3% from August 2023.
NOTES: August 2019 and August 2024 employment (seasonally adjusted) not shown for water (66,500 and 73,700, respectively) or pipeline (51,800 and 53,300, respectively) transportation. All-time highs (seasonally adjusted) with records beginning in 1990: air March 2001 (633,600); pipeline July 1991 (61,200); rail January 1990 (278,100); transit June 2019 (503,900); truck July 2022 (1,587,900); warehousing and storage May 2022 (1,942,200); and water June 2024 (75,800)
In addition to updating the Unemployment in Transportation and the Employment in Transportation: Total, by Mode, and Women dashboards, BTS also updated the Race and Hispanic or Latino Ethnicity of Transportation Workers dashboard.
Charts updated this month by section include:
Unemployment in the Transportation and Warehousing Sector and in Transportation and Material Moving Occupations
Monthly Employment in the Transportation and Warehousing Sector, Establishment Data
- Monthly Employment in the Transportation and Warehousing Sector
- Monthly Employment in the Transportation and Warehousing Sector by Mode
- Women Workers in the Transportation and Warehousing Sector
Monthly Employment in the Transportation and Warehousing Sector by Race and Hispanic or Latino Ethnicity, Household Data
Visit Transportation Economic Trends for more topics.
The unemployment rate is the total number of unemployed persons, expressed as a percentage of the civilian labor force. The civilian labor force includes all persons aged 16 and older who are employed and unemployed; meaning they are either currently working or actively looking for work. Unemployed persons include those who actively sought a job within the last four weeks. People waiting to start a new job who have not actively sought a job in the last four weeks are not counted as employed or unemployed; they are considered to be out of the labor force.
An unemployed person’s industry is the industry for the last job they held in the workforce, which may or may not reflect their current job search field or industry.
Similar Stories

Asian nations are building new trading zones to deflect the Trump tariff impact
View Article
Tighter supply and higher prices reshape Pacific Rim softwood markets
View Article
WCAworld launches emergency appeal to support earthquake relief efforts in Venezuela
View Article
U.S. international trade in goods and services, May 2026
View ArticleLiege will see global e-commerce leaders gather under one roof
The EU Cross-Border E-commerce Forum (EU CBEC) 2026 is celebrating having passed the 1,000-mark in registered attendees for the first time ever.
View Article
Indonesia’s Ministry of Forestry, WCS Indonesia and CMA CGM strengthen partnership to combat illegal wildlife trade
View ArticleGet the most up-to-date trending news!
SubscribeIndustry updates and weekly newsletter direct to your inbox!
Follow us on social media:
![]()
![]()


