ATA Truck Tonnage Index Fell 5.6% in August
Sep 22, 2020Index 8.9% below August 2019
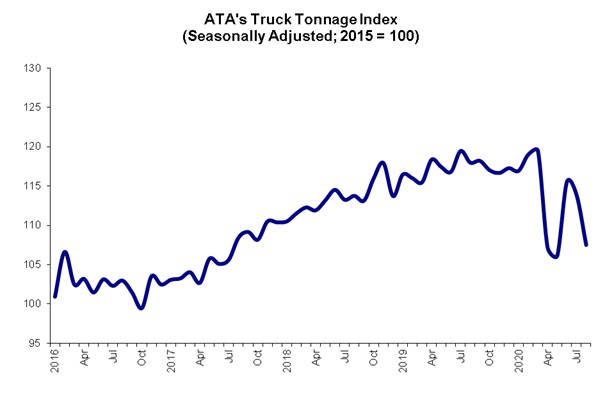
American Trucking Associations’ advanced seasonally adjusted (SA) For-Hire Truck Tonnage Index decreased 5.6% in August after declining 1.4% in July. In August, the index equaled 107.5 (2015=100) compared with 113.9 in July.
“The August softness suggests that freight is very uneven in the trucking industry,” said ATA Chief Economist Bob Costello. “The trucking sectors that haul for the industrial and energy industries are not seeing the surge in freight like the consumer side of the economy. The industrial loads tend to be heavier, so they count more in a tonnage calculation than most consumer-related loads. Fleets hauling for retailers are generally seeing strong freight volumes. Carriers hauling heavier industrial products generally saw softer volumes in August.”
July’s decrease was revised up to -1.4% from our August 18 press release.
Compared with August 2019, the SA index contracted 8.9%, the fifth straight year-over-year decline. Year-to-date, compared with the same period in 2019, tonnage is down 3.4%.
The not seasonally adjusted index, which represents the change in tonnage actually hauled by the fleets before any seasonal adjustment, equaled 112.8 in August, 3.9% below the July level (117.3). In calculating the index, 100 represents 2015. ATA’s For-Hire Truck Tonnage Index is dominated by contract freight as opposed to spot market freight.
Trucking serves as a barometer of the U.S. economy, representing 72.5% of tonnage carried by all modes of domestic freight transportation, including manufactured and retail goods. Trucks hauled 11.84 billion tons of freight in 2019. Motor carriers collected $791.7 billion, or 80.4% of total revenue earned by all transport modes.
ATA calculates the tonnage index based on surveys from its membership and has been doing so since the 1970s. This is a preliminary figure and subject to change in the final report issued around the 5th day of each month. The report includes month-to-month and year-over-year results, relevant economic comparisons, and key financial indicators.
Similar Stories

JB Hunt reports second quarter 2026 results
View Article
How to protect high value-high security freight
View Article
CrownX | Driver app wins business for air freight trucking firms
View Article
Southeastern Freight Lines appoints Tom Henrici to Service Center Manager in Raleigh, North Carolina
View Article
Vanishing capacity is finally turning the tide on the freight recession
View Article
AAR launches Freight Rail Research Consortium to advance research and policy
View ArticleGet the most up-to-date trending news!
SubscribeIndustry updates and weekly newsletter direct to your inbox!
Follow us on social media:
![]()
![]()


