Wind has surpassed hydro as most-used renewable electricity generation source in US
Feb 26, 2020
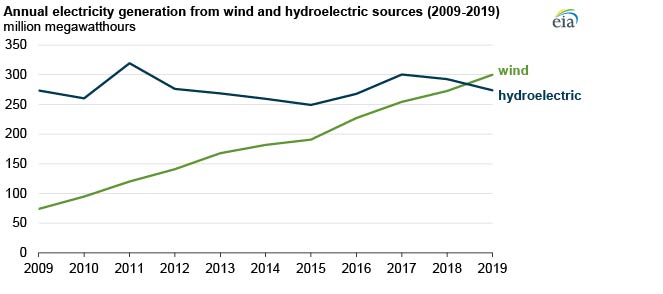
In 2019, U.S. annual wind generation exceeded hydroelectric generation for the first time, according to the U.S. Energy Information Administration’s Electric Power Monthly. Wind is now the top renewable source of electricity generation in the country, a position previously held by hydroelectricity.
Annual wind generation totaled 300 million megawatthours (MWh) in 2019, exceeding hydroelectric generation by 26 million MWh. Wind generation has increased steadily during the past decade, in part, because the Production Tax Credit (PTC), which drove wind capacity additions, was extended. Annual hydroelectric generation has fluctuated between 250 million MWh and 320 million MWh in the past decade, reflecting a stable capacity base and variable annual precipitation.

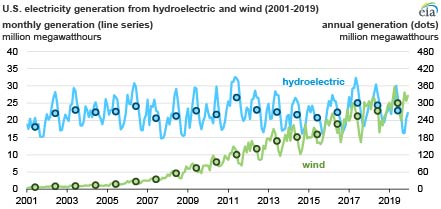
Annual changes in hydroelectric generation are primarily the result of variations in annual precipitation patterns and water runoff. Although weather patterns also affect wind generation in different regions, capacity growth has been the predominant driver of annual changes in wind generation.
Both hydroelectric and wind generation follow seasonal patterns. Hydroelectric generation is typically greatest in the spring when precipitation and melting snowpack increase water runoff. Seasonal patterns in wind generation vary across the country, but wind generation is usually greatest in the spring and fall.

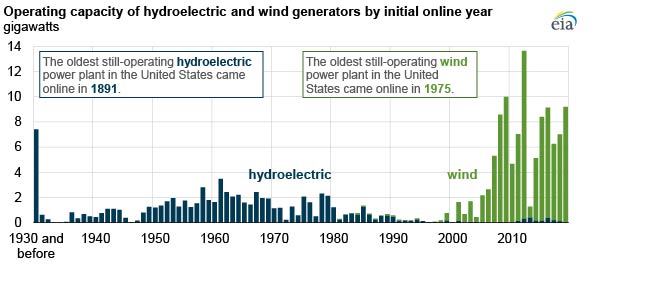
Wind capacity additions tend to come online during the fourth quarter of the year, most likely because of tax benefits. Wind capacity additions totaled 10 gigawatts in 2019 (3.8 GW installed in the fourth quarter), making 2019 the second-largest year for wind capacity additions, second only to 2012.
As of the end of 2019, the United States had 103 GW of wind capacity, nearly all of which (77%) were installed in the past decade. The United States has 80 GW of hydroelectric capacity, most of which has been operating for several decades. Only 2 GW of hydroelectric capacity has been added in the past decade, and some of those additions involved converting previously nonpowered dams.
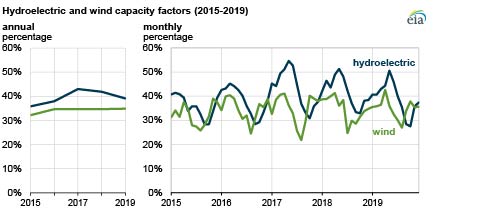
Although total installed wind capacity surpassed total installed hydroelectric capacity in 2016, it wasn’t until 2019 that wind generation surpassed hydroelectric generation. The average annual capacity factors for the hydroelectric fleet between 2009 and 2019 ranged from 35% to 43%. The average annual capacity factors for the U.S. wind fleet were lower, ranging from 28% to 35%. Capacity factors are the ratio of the electrical energy produced by a generating unit for a specified period of time to the electrical energy that could have been produced at continuous full power operation during the same period.

Similar Stories

Stena RoRo takes delivery of the battery hybrid vessel Guillaume de Normandie
View Article
Improved efficiency is enabling record U.S. crude oil production from fewer rigs
View Article
U.S. Department of Energy announces $7.1M in support of local energy project planning, siting and permitting
View Article
Performance of Global Shipping segments to diverge in 2025
View Article
Clean Arctic response to Kerch Strait heavy fuel oil spill from Antiquated Tankers
View Article
Dragonfly Energy and Stevens Transport, Inc. champion fleet hybridization with Battle Born® All-Electric APU deal
View ArticleGet the most up-to-date trending news!
SubscribeIndustry updates and weekly newsletter direct to your inbox!


