US Airlines net loss was $225 million in first quarter 2025
Jun 18, 2025US Airlines net loss was $225 million in first quarter 2025, a decrease in net loss over first quarter 2024

U.S. airline financial reports are filed quarterly with the Bureau of Transportation Statistics (BTS). See the tables that accompany this release on the BTS website for additional first-quarter 2025 (Tables 1-6) financial results.
1Q 2025 Results for All 24 Scheduled U.S. Passenger Airlines
U.S. scheduled passenger airlines reported a first-quarter 2025 after-tax net loss of $225 million and a pre-tax operating profit of $138 million.
One year earlier, in the first quarter of 2024, the airlines reported an after-tax net loss of $1.7 billion and a pre-tax operating loss of $297 million.
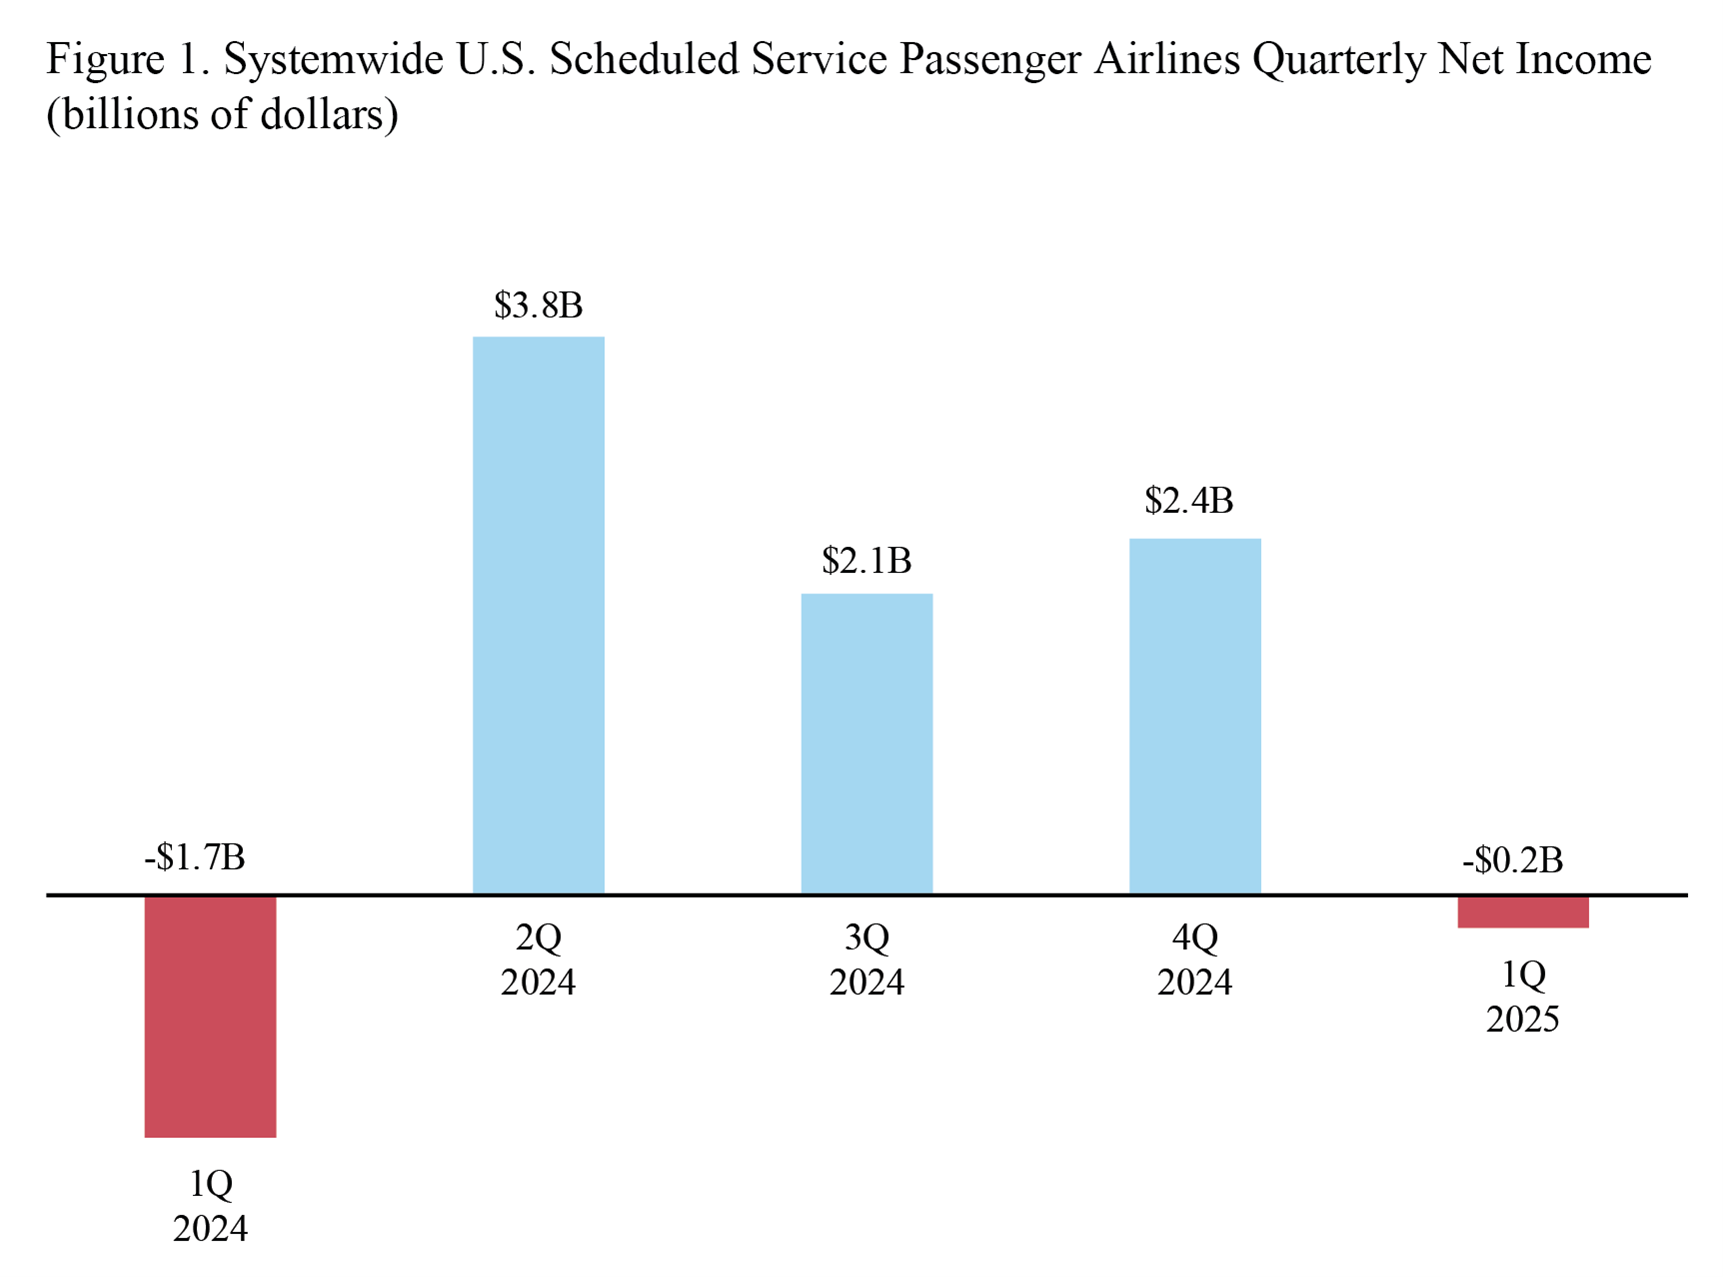
After-tax net income
- $225 million loss in 1Q 2025
- Compared to $2.4 billion gain in 4Q 2024
- Compared to $1.7 billion loss in 1Q 2024
Pre-tax operating profit
- $138 million gain in 1Q 2025
- Compared to $4.4 billion gain in 4Q 2024
- Compared to $297 million loss in 1Q 2024
- Total 1Q 2025 operating revenue: $57.5 billion:
- Share of total 1Q 2025 operating revenue:
- Fares: $42.6 billion, 74.1% compared to 74.6% in 1Q 2024
- Baggage fees: $1.6 billion, 2.9% compared to 3.1% in 1Q 2024
- Reservation change fees: $233 million, 0.4% compared to 0.4% in 1Q 2024
- Share of total 1Q 2025 operating revenue:
Fees are included for calculations of net income, operating revenue and operating profit or loss.
- Total 1Q 2025 operating expenses: $57.4 billion:
- Share of total 1Q 2025 operating revenue:
- Fares: $9.8 billion, 17.1% compared to 20.0% in 1Q 2024
- Labor: $21.5 billion, 37.4% compared to 35.8% in 1Q 2024
- Share of total 1Q 2025 operating revenue:
Domestic operations, includes 24 U.S. airlines:
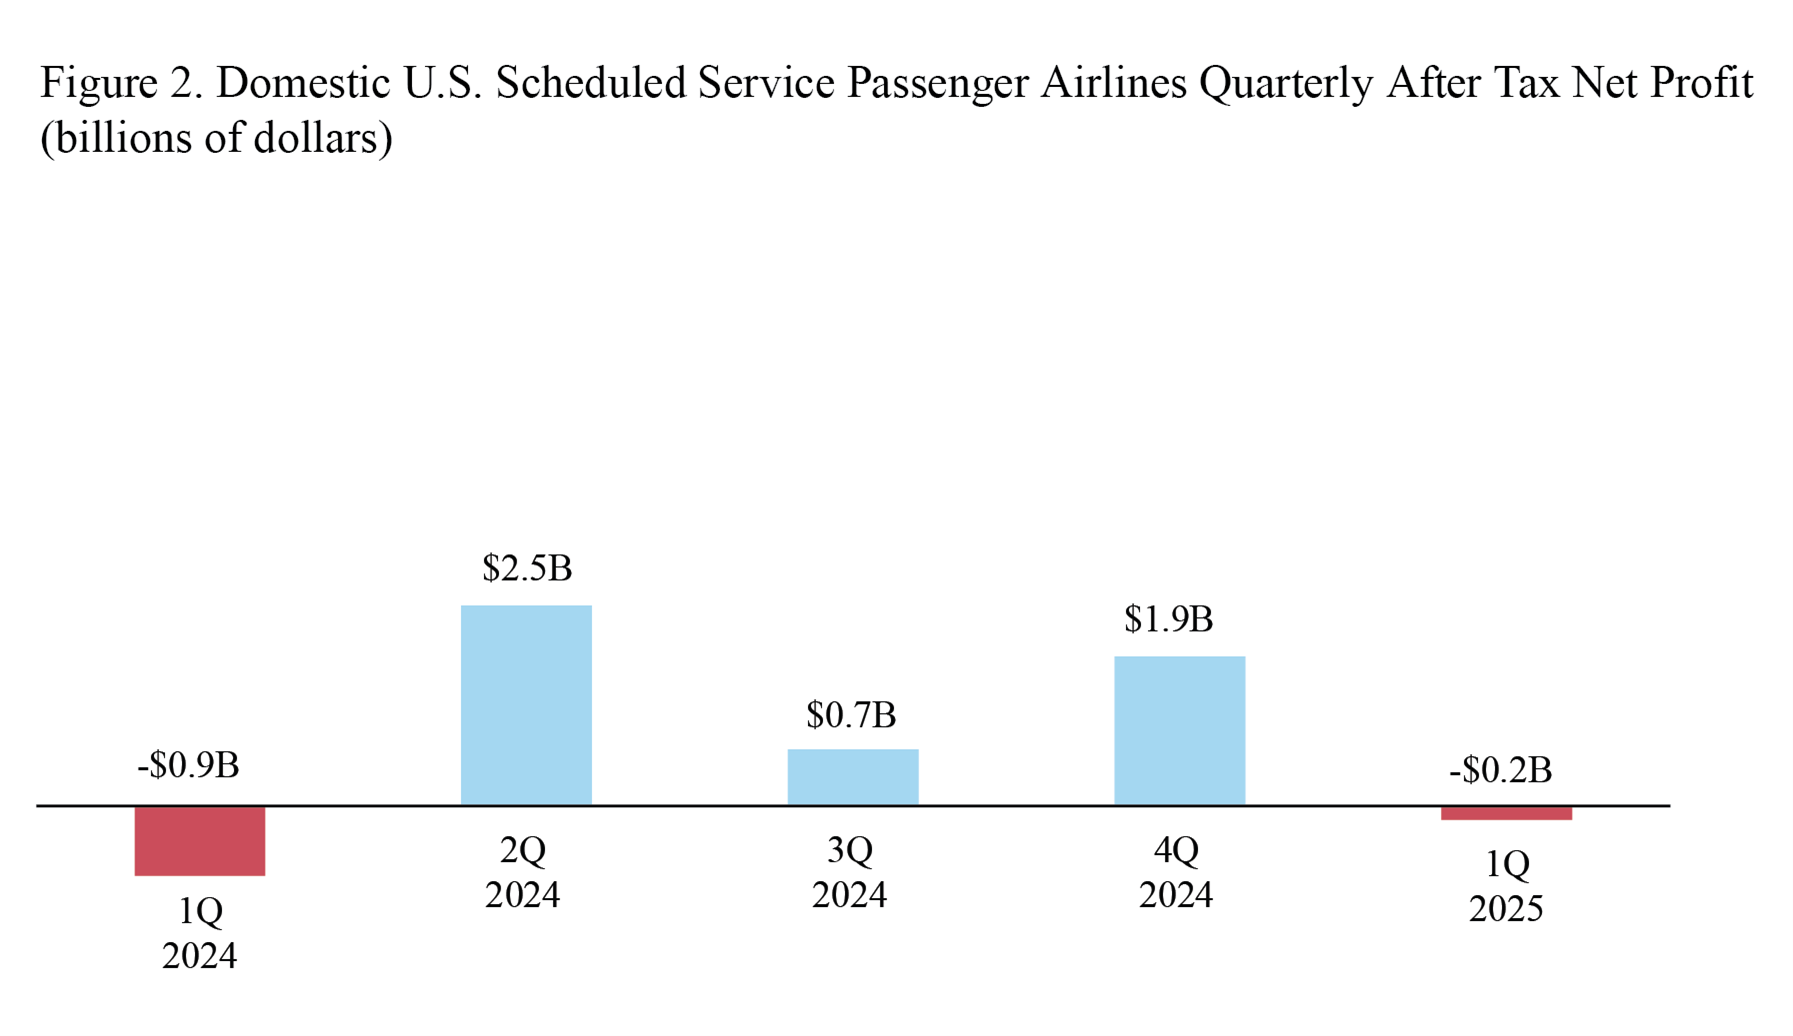
After-tax domestic net profit (net income)
- $173 million loss in 1Q 2025
- Compared to $1.9 billion gain in 4Q 2024
- Compared to $872 million loss in 1Q 2024
Pre-tax domestic operating profit
- $18 million loss in 1Q 2025
- Compared to $3.4 billion gain in 4Q 2024
- Compared to 111 million gain in 1Q 2024
- 1Q 2025 domestic operating revenue: $43.3 billion
- Share of total 1Q 2025 domestic operating revenue:
- Fares: $30.8 billion, 71.3%, compared to 71.8% in 1Q 2024
- Baggage fees: $1.3 billion, 3.0%, compared to 3.2% in 1Q 2024
- Reservation change fees: $190 million, 0.4%, compared to 0.5% in 1Q 2024
- Share of total 1Q 2025 domestic operating revenue:
Fees are included for calculations of net income, operating revenue and operating profit or loss.
- 1Q 2025 domestic operating expenses: $43.3 billion, of which:
- Share of total 1Q 2025 domestic operating expenses:
- Fuel: $6.7 billion, 15.5%, compared to 18.2% in 1Q 2024
- Labor: $16.1 billion, 37.1%, compared to 35.7% in 1Q 2024
- Share of total 1Q 2025 domestic operating expenses:
International operations, includes 19 U.S. airlines:
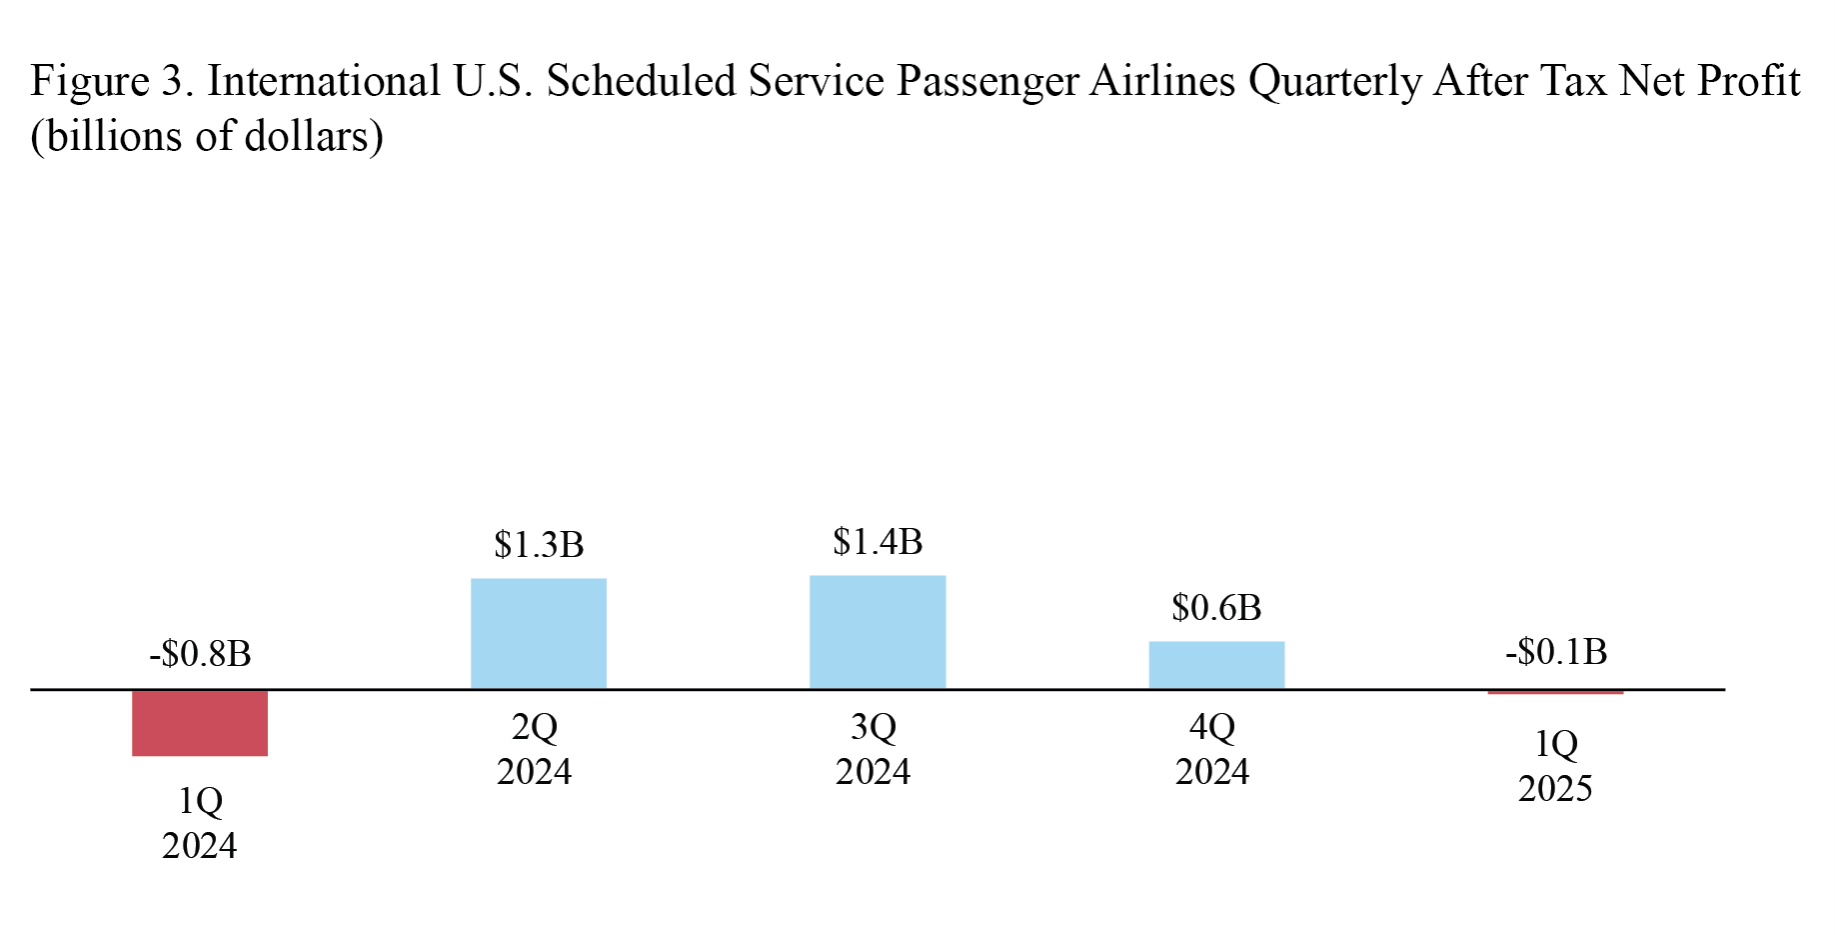
After-tax international net profit (net income)
- $52 million loss in 1Q 2025
- Compared to $572 million gain in 4Q 2024
- Compared to $789 million loss in 1Q 2024
Pre-tax international operating profit
- $157 million gain in 1Q 2025
- Compared to $1.0 billion gain in 4Q 2024
- Compared to $407 million loss in 1Q 2024
- 1Q 2025 international operating revenue: $14.3 billion, of which:
- Share of 1Q 2025 international operating revenue:
- Fares: $11.8 billion, 82.8%, compared to 83.1% in 1Q 2025
- Baggage fees: $337 million, 2.4%, compared to 2.6% in 1Q 2024
- Reservation change fees: $43 million, 0.3%, compared to 0.3% in 1Q 2024
- Share of 1Q 2025 international operating revenue:
Fees are included for calculations of net income, operating revenue and operating profit or loss.
- 1Q 2025 international operating expenses: $14.1 billion, of which:
- Share of total 1Q 2025 international operating expenses:
- Fuel: $3.1 billion, 21.9%, compared to 25.3% in 1Q 2024
- Labor: $5.4 billion, 38.5%, compared to 36.0% in 1Q 2024
- Share of total 1Q 2025 international operating expenses:
1st Quarter Margins
Net margin is the net income or loss as a percentage of operating revenue. Operating margin is the operating profit or loss as a percentage of operating revenue.
Systemwide:
Net income margin:
- -0.4% in 1Q2025
- Compared to -3.0% in 1Q2024
Operating margin:
- 0.2% in 1Q2025
- Compared to -0.5% in 1Q2024
Domestic
Net income margin:
- -0.4% in 1Q2025
- Compared to -2.1% in 1Q2024
Operating margin:
- 0.0% in 1Q2025
- Compared to 0.3% in 1Q2024
International
Net income margin:
- -0.4% in 1Q2025
- Compared to -5.7% in 1Q2024
Operating margin:
- 1.1% in 1Q2025
- Compared to -3.0% in 1Q2024
Reporting notes
Additional data: BTS website, see tables for operating profit/loss, operating revenue and fuel cost and consumption. See the BTS financial databases for more detailed data including numbers for individual airlines.
Filing requirement: By regulation, for the quarter ending Dec. 31, airlines that operate at least one aircraft that is designed/certified for more than 60 seats or the capacity to carry a payload of passengers and cargo weighing more than 18,000 pounds must report financial data to BTS by March 31. The airline filings are subject to a process of quality assurance and data validations before release to the public.
Data updates: Revised carrier data and late data filings will be made available monthly on TranStats on the Monday following the second Tuesday of the month. All data are subject to revision. BTS will release second-quarter 2025 data on September 16, 2025
Missing carriers: The information provided within BTS statistical releases may not be based on 100% of reporting carriers. Generally, data are released per schedule if reports have been received from at least 90% of the carriers, along with data from all the major carriers. Regarding this release, the following carriers remain pending: ZW (Air Wisconsin Airlines), NC (Northern Air Cargo), KH (Aloha Air Cargo). Also, within text, percent change results may not be exact due to rounding.
Similar Stories

Soaring AI shipments invigorate air cargo’s resilience as global demand rises +7% in June
View ArticleGEODIS achieves IATA CEIV Pharma certification in Hyderabad (India)
GEODIS achieves IATA CEIV Pharma certification for its Hyderabad site in India, validating its ability to handle pharmaceutical and healthcare shipments to the highest international standards.
View Article
Air India Cargo partners with cargo.one to power its strategic transition into digital sales
View Article
Unilode and Condor strengthen partnership with Full ULD Management renewal
View ArticleGlobal Aerospace Summit returns to the St. Louis Region August 19 – 20
Building on the success of the inaugural event last summer, the Global Aerospace Summit will return to the St. Louis region August 19–20, 2026.
View Article
Port of Maputo launches Mozambique’s first Port Community System initiative; Kalé selected as technology partner
View ArticleGet the most up-to-date trending news!
SubscribeIndustry updates and weekly newsletter direct to your inbox!
Follow us on social media:
![]()
![]()


