U.S. International Trade in Goods and Services, January 2023
Mar 08, 2023The U.S. Bureau of Economic Analysis (BEA) has issued the following news release today:
The U.S. monthly international trade deficit increased in January 2023 according to the U.S. Bureau of Economic Analysis and the U.S. Census Bureau. The deficit increased from $67.2 billion in December (revised) to $68.3 billion in January, as imports increased more than exports. The goods deficit decreased $0.6 billion in January to $90.1 billion. The services surplus decreased $1.7 billion in January to $21.8 billion.
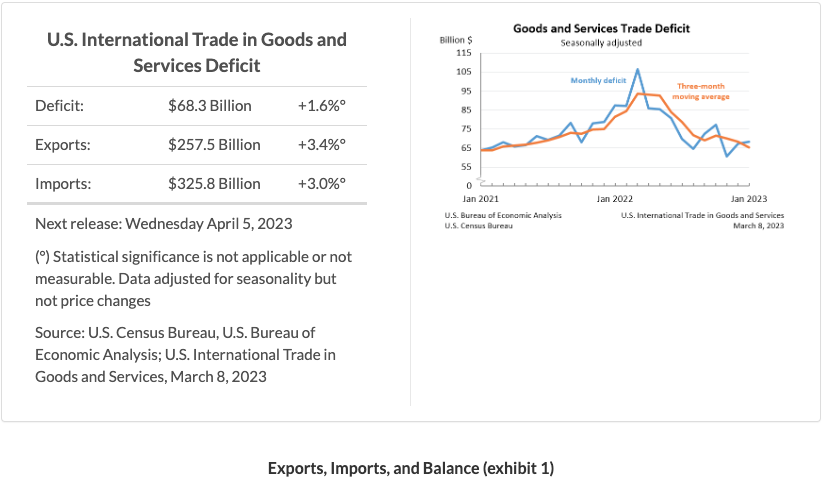
January exports were $257.5 billion, $8.5 billion more than December exports. January imports were $325.8 billion, $9.6 billion more than December imports.
The January increase in the goods and services deficit reflected a decrease in the goods deficit of $0.6 billion to $90.1 billion and a decrease in the services surplus of $1.7 billion to $21.8 billion.
Year-over-year, the goods and services deficit decreased $19.2 billion, or 21.9 percent, from January 2022. Exports increased $30.2 billion or 13.3 percent. Imports increased $11.0 billion or 3.5 percent.
Three-Month Moving Averages (exhibit 2)
The average goods and services deficit decreased $3.0 billion to $65.4 billion for the three months ending in January.
Average exports increased $0.3 billion to $252.8 billion in January.
Average imports decreased $2.7 billion to $318.2 billion in January.
Year-over-year, the average goods and services deficit decreased $16.0 billion from the three months ending in January 2022.
Average exports increased $23.5 billion from January 2022.
Average imports increased $7.5 billion from January 2022.
Exports (exhibits 3, 6, and 7)
Exports of goods increased $10.1 billion to $177.8 billion in January.
Exports of goods on a Census basis increased $8.3 billion.
Consumer goods increased $4.1 billion.
Pharmaceutical preparations increased $2.8 billion.
Capital goods increased $1.9 billion.
Civilian aircraft increased $0.5 billion.
Telecommunications equipment increased $0.3 billion.
Automotive vehicles, parts, and engines increased $1.2 billion.
Other automotive parts and accessories increased $0.7 billion.
Passenger cars increased $0.3 billion.
Net balance of payments adjustments increased $1.8 billion.
Exports of services decreased $1.6 billion to $79.7 billion in January.
Travel decreased by $1.2 billion.
Transport decreased by $0.7 billion.
Other business services increased $0.3 billion.
Imports (exhibits 4, 6, and 8)
Imports of goods increased from $9.5 billion to $267.9 billion in January.
Imports of goods on a Census basis increased $9.5 billion.
Consumer goods increased $4.1 billion.
Cell phones and other household goods increased $1.6 billion.
Pharmaceutical preparations increased $0.9 billion.
Toys, games, and sporting goods increased $0.8 billion.
Automotive vehicles, parts, and engines increased $3.1 billion.
Trucks, buses, and special purpose vehicles increased $1.4 billion.
Passenger cars increased $1.4 billion.
Capital goods increased $1.4 billion.
Electric apparatus increased $0.8 billion.
Telecommunications equipment increased $0.7 billion.
Net balance of payments adjustments decreased less than $0.1 billion.
Imports of services increased $0.1 billion to $57.9 billion in January.
Travel increased $1.1 billion.
Transport decreased $1.0 billion.
Real Goods in 2012 Dollars – Census Basis (exhibit 11)
The real goods deficit increased $3.5 billion, or 3.6 percent, to $101.8 billion in January, compared to a 1.4 percent increase in the nominal deficit.
Real exports of goods increased $5.9 billion, or 3.8 percent, to $162.7 billion, compared to a 5.0 percent increase in nominal exports.
Real imports of goods increased $9.5 billion, or 3.7 percent, to $264.4 billion, compared to a 3.7 percent increase in nominal imports.
Revisions
Exports and imports of goods and services were revised for July through December 2022 to incorporate more comprehensive and updated quarterly and monthly data. In addition to these revisions, seasonally adjusted data for all months of 2022 were revised so that the totals of the seasonally adjusted months equal the annual totals.
Revisions to December exports
Exports of goods were revised down $0.5 billion.
Exports of services were revised down $0.7 billion.
Revisions to December imports
Imports of goods were revised down $0.4 billion.
Imports of services were revised down $1.0 billion.
Goods by Selected Countries and Areas: Monthly – Census Basis (exhibit 19)
The January figures show surpluses, in billions of dollars, with South and Central America ($4.8), Netherlands ($3.2), United Kingdom ($2.7), Belgium ($1.8), Australia ($1.5), Hong Kong ($1.5), Brazil ($0.6), and Singapore ($0.4). Deficits were recorded, in billions of dollars, with China ($21.9), European Union ($18.5), Mexico ($12.2), Vietnam ($8.0), Germany ($7.2), Japan ($5.6), Canada ($5.4), Ireland ($4.6), India ($4.5), South Korea ($3.7), Italy ($3.6), Taiwan ($3.5), Malaysia ($2.8), Switzerland ($1.4), France ($1.1), Israel ($0.6), and Saudi Arabia ($0.2).
The surplus with the Netherlands decreased $1.2 billion to $3.2 billion in January. Exports decreased $0.6 billion to $6.3 billion and imports increased $0.6 billion to $3.1 billion.
The deficit with India increased $1.2 billion to $4.5 billion in January. Exports increased $0.1 billion to $3.3 billion and imports increased $1.3 billion to $7.7 billion.
The deficit with Japan decreased $1.6 billion to $5.6 billion in January. Exports increased $0.3 billion to $6.5 billion and imports decreased $1.2 billion to $12.1 billion.
Goods and Services by Selected Countries and Areas: Quarterly – Balance of Payments Basis (exhibit 20)
Statistics on trade in goods and services by country and area are only available quarterly, with a one-month lag. With this release, fourth-quarter figures are now available.
The fourth-quarter figures show surpluses, in billions of dollars, with South and Central America ($22.8), Netherlands ($14.2), Singapore ($7.8), United Kingdom ($7.1), Australia ($6.7), Brazil ($6.0), Hong Kong ($5.1), Belgium ($1.0), and Switzerland ($0.7). Deficits were recorded, in billions of dollars, with China ($63.0), European Union ($39.0), Mexico ($37.2), Vietnam ($25.5), Germany ($23.9), Japan ($18.6), Italy ($12.4), Taiwan ($11.3), India ($9.7), South Korea ($8.8), Malaysia ($8.6), Canada ($7.5), France ($4.9), Israel ($2.8), Ireland ($2.1), and Saudi Arabia ($0.4).
The deficit with China decreased $30.2 billion to $63.0 billion in the fourth quarter. Exports increased $1.7 billion to $51.1 billion and imports decreased $28.5 billion to $114.1 billion.
The deficit with Canada decreased $6.8 billion to $7.5 billion in the fourth quarter. Exports decreased $1.1 billion to $108.5 billion and imports decreased $7.9 billion to $116.0 billion.
The deficit with the European Union increased $13.0 billion to $39.0 billion in the fourth quarter. Exports increased $0.2 billion to $151.2 billion and imports increased $13.2 billion to $190.2 billion.
All statistics referenced are seasonally adjusted; statistics are on a balance of payments basis unless otherwise specified. Additional statistics, including not seasonally adjusted statistics and details for goods on a Census basis, are available in exhibits 1-20b of this release. For information on data sources, definitions, and revision procedures, see the explanatory notes in this release. The full release can be found at www.census.gov/foreign-trade/Press-Release/current_press_release/index.html or www.bea.gov/data/intl-trade-investment/international-trade-goods-and-services. The full schedule is available in the Census Bureau's Economic Briefing Room at www.census.gov/economic-indicators/ or on BEA's website at www.bea.gov/news/schedule .
Next release: April 5, 2023, at 8:30 a.m. EDT
U.S. International Trade in Goods and Services, February 2023
Similar Stories

Key European shipping corridor hit by river and rail freight ‘double whammy’
View Article
DHL Group deploys Disaster Response Team to Venezuela
View Article
Asian nations are building new trading zones to deflect the Trump tariff impact
View Article
Tighter supply and higher prices reshape Pacific Rim softwood markets
View Article
WCAworld launches emergency appeal to support earthquake relief efforts in Venezuela
View Article
U.S. international trade in goods and services, May 2026
View ArticleGet the most up-to-date trending news!
SubscribeIndustry updates and weekly newsletter direct to your inbox!
Follow us on social media:
![]()
![]()


