The central United States set several wind power records this spring
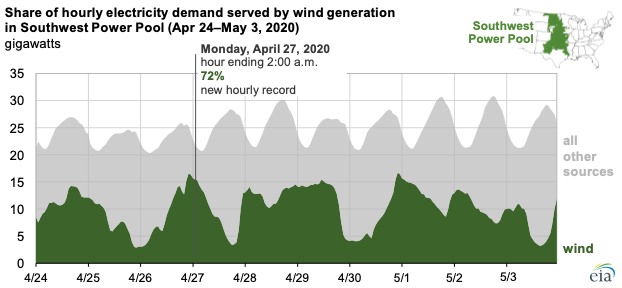
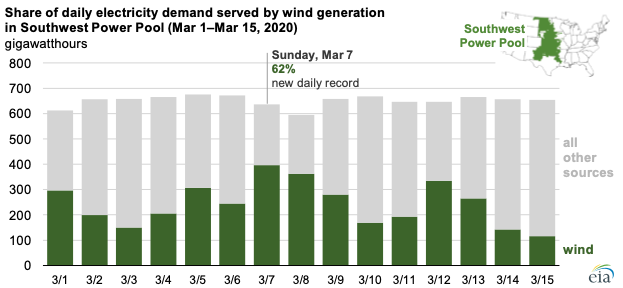
Jun 12, 2020Earlier this year, the Southwest Power Pool (SPP), the regional transmission organization that manages the electric grid for much of the central United States, set records for the highest share of electricity demand supplied by wind power in both a single-hour period (72%) and a full day (62%).
In 2019, wind power provided 29% of the electricity demand in SPP. On a monthly basis, wind power’s share of total demand in 2019 ranged from a high of 37% in October to a low of 18% in August. On a daily or hourly basis, however, wind’s share can be larger because of fluctuations in wind output and in total electricity generation.

On Saturday, March 7, 2020, the wind penetration rate, expressed as the share of electricity demand supplied by wind generation, reached 62% in SPP. On an hourly basis, wind generated a high share of 72% of electricity demand in the early morning of Monday, April 27, 2020, from 1:00 a.m. to 2:00 a.m. Central time.
Wind penetration can be expressed as wind generation’s share of either electricity demand or total generation. System operators like SPP are responsible for balancing electricity supply and demand in real time. To maintain this balance, SPP primarily uses its own energy generation resources to meet demand and engages in limited energy trade with neighboring system operators for economic or reliability purposes. Net electricity interchange (electricity imports to or exports from the region) for SPP averaged about 2% of generation in 2019.

Records for wind penetration are often broken in the spring because of seasonal patterns in both electricity demand and wind power output. In the SPP region, wind generation is often highest in the spring months. Spring is also a time of year when electricity demand is relatively low because mild temperatures mean less electricity is used to heat or cool homes. Electricity demand is also relatively lower on weekends, which is when wind set its recent record shares in SPP.
In addition to seasonal patterns, wind generation follows daily patterns. Land-based wind generation is greatest overnight, when stronger winds typically occur. As a result, wind power records tend to be set in the early hours of the morning.
To take advantage of favorable wind resources, SPP has invested heavily in building new wind capacity. According to data from the U.S. Energy Information Administration's (EIA) inventory of utility-scale power plants, SPP had 21 gigawatts of nameplate wind generating capacity as of March 2020, which represents 24% of total SPP power generating capacity and 20% of the total utility-scale wind generating capacity in the United States.
These wind records are based on data from EIA’s Hourly Electric Grid Monitor, which provides up-to-the-hour information on electricity demand and interchange across the U.S. electric grid. Data on hourly generation by energy source and subregion are available back to September 2018. Although EIA does not have data on hours or days that may have had a higher wind generation share before 2018, when EIA began collecting data for the Hourly Electric Grid Monitor, the growth in wind capacity over the past several years makes it unlikely a higher share was generated in earlier years.
Principal contributors: Chris Namovicz, Richard Bowers
Similar Stories

2024 Supply Chain Risk Trends Analysis
View Article
Global foreign investments: Diverging trends amid global challenges
View Article
EIA forecasts lower oil price in 2025 amid significant market uncertainties
View Article
Cathay Pacific releases traffic figures for December 2024
View Article
Envana secures grant for $5.2M DOE Methane Mitigation Technology Project
View ArticleFTR Reports U.S. trailer net orders in December at 25,334 units, the most since October 2023
Total trailer production declined 10% m/m in December to 11,827 units, a relatively typical seasonal drop. However, production was down 40% y/y – 43% below the five-year December average –…
View ArticleGet the most up-to-date trending news!
SubscribeIndustry updates and weekly newsletter direct to your inbox!


