September 2025 U.S. transportation sector unemployment (4.3%) falls below the 2024 Level (5.1%)
Nov 21, 2025September 2025 U.S. Transportation Sector Unemployment (4.3%) Falls Below the September 2024 Level (5.1%)
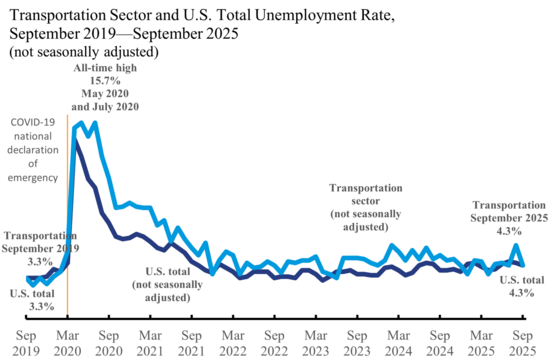
The unemployment rate in the U.S. transportation sector was 4.3% (not seasonally adjusted) in September 2025 according to the Bureau of Labor Statistics (BLS). These data have been updated on the Bureau of Transportation Statistics’ (BTS) Unemployment in Transportation dashboard. In September 2025, the transportation sector unemployment rate fell 0.8 percentage points from 5.1% in September 2024. Unemployment in the transportation sector reached its highest level during the COVID-19 pandemic (15.7%) in May 2020 and July 2020.
Unemployment in the transportation sector was the same as overall unemployment. BLS reports that the U.S. unemployment rate, not seasonally adjusted, in September 2025 was 4.3% or 0.0 percentage points different from the transportation sector rate. Seasonally adjusted, the U.S. unemployment rate in September 2025 was 4.4%.
 |
Seasonally adjusted, employment in the transportation and warehousing sector fell to 6,709,900 in September 2025 — down 0.4% from the previous month but up 0.6% from September 2024. By mode (seasonally adjusted):
- Air transportation fell to 577,600 in September 2025 — down 0.2% from the previous month but up 2.2% from September 2024.
- Truck transportation fell to 1,516,700 in September 2025 — down 0.4% from the previous month but up 0.1% from September 2024.
- Transit and ground passenger transportation rose to 487,500 in September 2025 — up 0.6% from the previous month and up 1.2% from September 2024.
- Rail transportation fell to 151,900 in September 2025 — down 0.1% from the previous month and down 1.9% from September 2024.
- Water transportation fell to 72,000 in September 2025 — down 0.7% from the previous month but up 2.9% from September 2024.
- Pipeline transportation fell to 60,800 in September 2025 — down 0.7% from the previous month but up 8.6% from September 2024.
- Warehousing and storage fell to 1,812,300 in September 2025 — down 0.6% from the previous month and down 2.1% from September 2024.
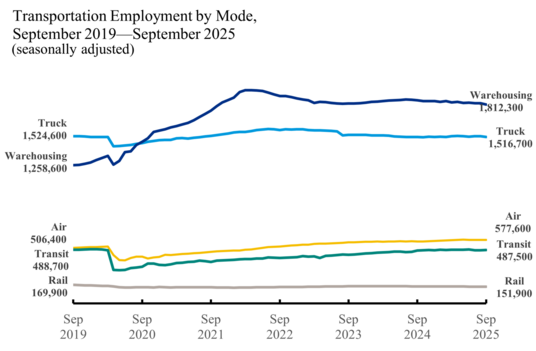 |
NOTES: September 2019 and September 2025 employment (seasonally adjusted) not shown for water (66,700 and 72,000, respectively) or pipeline (51,800 and 60,800, respectively) transportation. All-time highs (seasonally adjusted) with records beginning in 1990: air March 2001 (633,600); pipeline July 1991/August 2025 (61,200); rail January 1990 (278,100); transit June 2019 (503,900); truck July 2022 (1,587,900); warehousing and storage March 2022 (1,943,100); and water August 2025 (72,500)
Charts updated this month by section include:
Unemployment in the Transportation and Warehousing Sector and in Transportation and Material Moving Occupations
Monthly Employment in the Transportation and Warehousing Sector, Establishment Data
- Monthly Employment in the Transportation and Warehousing Sector
- Monthly Employment in the Transportation and Warehousing Sector by Mode
Visit Transportation Economic Trends for more topics.
The unemployment rate is the total number of unemployed persons, expressed as a percentage of the civilian labor force. The civilian labor force includes all persons aged 16 and older who are employed and unemployed; meaning they are either currently working or actively looking for work. Unemployed persons include those who actively sought a job within the last four weeks. People waiting to start a new job who have not actively sought a job in the last four weeks are not counted as employed or unemployed; they are considered to be out of the labor force.
An unemployed person’s industry is the industry for the last job they held in the workforce, which may or may not reflect their current job search field or industry.
Similar Stories

AI vertical among those most exposed to Middle East conflict
View Article
Signal Ocean Spotlight: Iron Ore – Disconnect between Chinese iron ore imports and steel production widens
View Article
Europe and Russia: A region of contrasts shaping global softwood markets
View Article
American Trailer Manufacturers Coalition applauds affirmative preliminary determination from DOC in AD/CVD trade case
View ArticleDOE’s Office of Critical Minerals and Energy Innovation announces $134 million to bolster rare earth element supply chains
Selected projects will strengthen domestic rare earth supply chains, reduce reliance on foreign sources, and improve U.S. energy security.
View Article
Merlo America welcomes new finance manager to support continued growth
View ArticleGet the most up-to-date trending news!
SubscribeIndustry updates and weekly newsletter direct to your inbox!
Follow us on social media:
![]()
![]()


![[Freightos Weekly Update] Container rates starting to spike on peak season rush](https://www.ajot.com/images/uploads/article/_thumbs/LB_stacked_containers.JPG)
