North American transborder freight decreased 4.9% in May 2025 from May 2024
Jul 23, 2025Source: Bureau of Transportation Statistics
TransBorder Freight Data: https://data.bts.gov/stories/s/kijm-95mr
The statistics in this release do not reflect changes in inflation or tonnage moved.
Total Transborder Freight by Border in May 2025, Compared to May 2024:
Transborder freight between the U.S. and North American countries Canada and Mexico:
- Total transborder freight: $132.1 billion of transborder freight moved by all modes of transportation, decreasing 4.9% compared to May 2024
- Freight between the U.S. and Canada: $57.6 billion, down 12.7% from May 2024
- Freight between the U.S. and Mexico: $74.5 billion, up 2.1% from May 2024
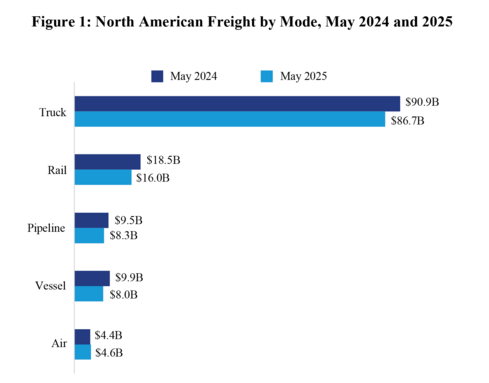
- Trucks moved $86.7 billion of freight, down 4.6% compared to May 2024
- Railways moved $16.0 billion of freight, down 13.6% compared to May 2024
- Pipelines moved $8.3 billion of freight, down 13.2% compared to May 2024
- Vessels moved $8.0 billion of freight, down 18.6% compared to May 2024
- Air moved $4.6 billion of freight, up 4.4% compared to May 2024
 |
Source: Bureau of Transportation Statistics
Total Transborder Freight by Border and Mode:
| U.S.-Canada (both directions) (Dollars in Billions) | U.S.-Mexico (both directions) (Dollars in Billions) | ||
| Truck | $32.3 | Truck | $54.4 |
| Pipeline | $7.5 | Rail | $8.6 |
| Rail | $7.4 | Vessel | $5.9 |
| Air | $2.4 | Air | $2.3 |
| Vessel | $2.2 | Pipeline | $0.7 |
Detroit, Port Huron, and Buffalo are the top truck ports for U.S. freight flows with Canada, while Laredo, El Paso, and Otay Mesa are the top truck ports with Mexico. Detroit, Port Huron, and International Falls are the top rail connection ports for U.S. freight flows with Canada, while Laredo, Eagle Pass, and El Paso are the top rail connection ports with Mexico. Chicago, Port Huron, and Minneapolis are the top pipeline connection regions for U.S. energy freight flows with Canada. El Paso, Hidalgo, and Laredo are the top pipeline connection regions with Mexico. Port of Boston, Arthur, and Portland are the top water port connections for U.S. energy flows with Canada. Port of Houston, Arthur, and Texas City are the top water port connections for U.S. energy flows on the Southern border.
U.S. – Canada and Mexico Freight Breakdown
U.S.-Canada | U.S.-Mexico | ||
Top three truck ports | Top three truck ports | ||
| Detroit, MI | $7.5 billion | Laredo, TX | $25.4 billion |
| Port Huron, MI | $7.3 billion | El Paso-Ysleta, TX | $8.7 billion |
| Buffalo, NY | $6.0 billion | Otay Mesa, CA | $4.9 billion |
Top three truck commodities | Top three truck commodities | ||
| Computers/parts | $5.6 billion | Computers/parts | $15.8 billion |
| Vehicles/parts | $4.0 billion | Electrical machinery | $11.3 billion |
| Electrical machinery | $2.4 billion | Vehicles/parts | $6.8 billion |
Top three rail ports | Top three rail ports | ||
| Detroit, MI | $2.2 billion | Laredo, TX | $4.0 billion |
| Port Huron, MI | $1.5 billion | Eagle Pass, TX | $2.8 billion |
| Int’l Falls, MN | $0.9 billion | Nogales, AZ | $0.8 billion |
Top three rail commodities | Top three rail commodities | ||
| Vehicles/parts | $3.0 billion | Vehicles/parts | $4.5 billion |
| Mineral fuel | $0.5 billion | Beverages/spirits | $0.6 billion |
| Plastics | $0.5 billion | Computer machinery | $0.6 billion |
Introducing the Forecast Model
TransBorder freight data are released with a two-month delay due to the nature of source data collection, processing, and validation. BTS has developed a model for projecting forecasts of this data gap. The overall goal is to improve the timeless and availability of this critical transportation data to support our researchers, analysts, and freight partners. The information can be found on the TransBorder Freight Data webpage at https://data.bts.gov/stories/s/Forecast/h73b-4dgk.
Reporting Notes
All monetary values are in current U.S. dollars and are not adjusted for inflation or seasonality. For previous statistical releases and summary tables, see transborder releases. See transborder freight data for data from previous months, and additional state, port, and commodity data. BTS has scheduled the next release of transborder numbers for Wednesday, August 20, 2025.
Similar Stories

US intermodal freight holds firm in July, IANA Index shows
View Article
AAR reports rail traffic for the week ending July 04, 2026
View Article
Gulftainer unveils global trade infrastructure strategy to build one of the Middle East’s largest integrated logistics ecosystems
View ArticleFreight rail industry closes fastest national bargaining round in decades
A collaborative process delivers a strong, efficient outcome for railroads, unions, and employees
View Article
Union Pacific and Norfolk Southern celebrate America’s 250th anniversary
View Article
Hannibal expands its connections with Northern Europe with the new Melzo – Rotterdam Europoort intermodal service
View ArticleGet the most up-to-date trending news!
SubscribeIndustry updates and weekly newsletter direct to your inbox!
Follow us on social media:
![]()
![]()


