
Europe ended winter 2022–23 with the most natural gas in storage on record
May 09, 2023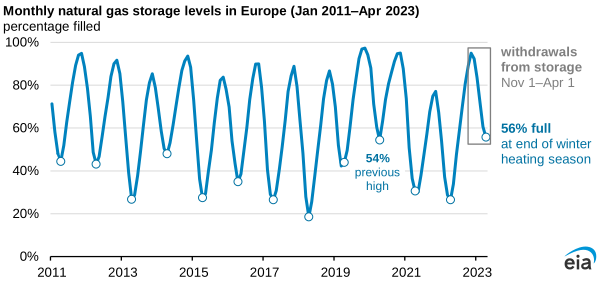
As of April 1, natural gas storage inventories were 56% full—the highest percentage on record for the end of a heating season (November 1 through March 31)—according to data from Gas Infrastructure Europe’s Aggregated Gas Storage Inventory (AGSI+). On April 1, natural gas storage in Europe totaled 2.02 trillion cubic feet (Tcf), exceeding the previous record of 1.98 Tcf at the end of winter 2019–20 and the five-year (2018–22) average of 1.21 Tcf. The winter of 2022–23 was Europe’s second-warmest winter on record and the warmest January, according to data from the National Oceanic and Atmospheric Administration (NOAA).
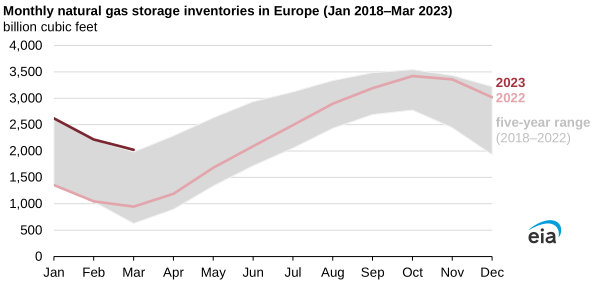
Most (97%) of the world’s liquefied natural gas (LNG) is consumed in the Northern Hemisphere, which experienced its fifth-warmest winter on record. Europe’s relatively full storage results from exceptionally warm winter temperatures, which reduced heating demand. Europe‘s effort to conserve natural gas and record-high LNG imports also helped offset lower imports by pipeline from Russia. Reduced demand for spot LNG in Asia because of a very warm winter and limited onsite storage, which remained full during most of the winter season, redirected record volumes of LNG from Asia to Europe.
In 2022, European governments enacted policies requiring storage operators to maximize storage injections during the refill season to ensure the availability of natural gas supply during winter. As a result, storage stocks on November 1 were 95% full, compared with the 12-year (2011–22) average of 89%, exceeding storage levels at the start of the heating season in 2021.
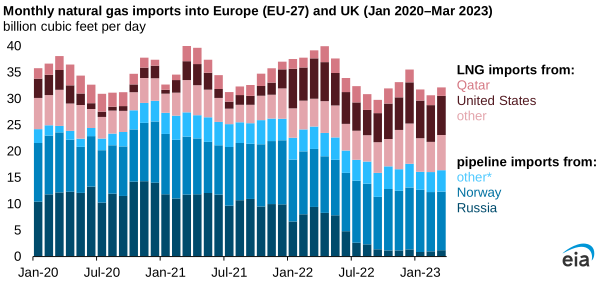
Europe and the UK typically rely on natural gas imports to meet more than 80% of natural gas consumption. Last year they shifted supply away from pipeline imports from Russia. Russia’s natural gas exports to Europe, which had averaged 8.8 billion cubic feet per day (Bcf/d) during winter 2021–22, declined by 87%, averaging 1.1 Bcf/d this past winter. Although natural gas imports by pipeline from Norway increased to 11.3 Bcf/d in 2022 (3% more than in 2021) and averaged 11.5 Bcf/d during the winter, a significant increase in LNG imports helped to refill storage inventories and balance the market, offsetting the decline in pipeline imports from Russia.
Europe’s LNG imports remained high throughout 2022, averaging 14.9 Bcf/d, 65% (5.8 Bcf/d) more than in 2021. During this past winter, LNG imports averaged 16.3 Bcf/d, reaching an all-time monthly high of 17.9 Bcf/d in December. Europe was the main destination for U.S. LNG exports in 2022. Last year, the United States remained the largest LNG supplier to Europe for the second year in a row, accounting for 44% (6.5 Bcf/d) of LNG imports into the region during 2022.
Similar Stories
Department of Transportation moves forward on Delfin LNG deepwater port licensing following court win
The U.S. Department of Transportation’s Maritime Administration (MARAD) will move forward with issuing a Deepwater port license to Delfin LNG following a decision by the U.S. Court of Appeals for…
View Article
The United States produced more crude oil than any other country in 2025
View Article
BTS motor fuel prices – June 2026
View Article
US-Iran ceasefire collapses after Strait of Hormuz attacks - Rystad Energy’s Breaking News Update
View Article
U.S. exports of crude oil and petroleum products reached record in April
View Article
U.S. airlines’ May 2026 aviation fuel cost up 3.0%, consumption up 3.5%, and fuel cost per gallon down 0.5% from April 2026
View ArticleGet the most up-to-date trending news!
SubscribeIndustry updates and weekly newsletter direct to your inbox!
Follow us on social media:


