California leads the United States in electric vehicles and charging locations
Dec 14, 2023
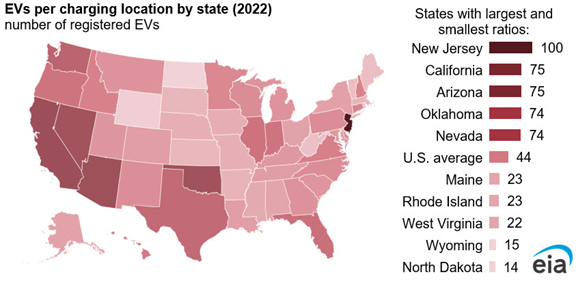
Data source: U.S. Energy Information Administration, State Energy Data System
Note: Data are for end of year. EV=electric vehicle.
California has led the United States in the number of electric vehicles (EVs) and EV charging locations every year since 2016, accounting for 37% of U.S. registered light-duty EVs and 27% of EV charging locations at the end of 2022, according to new estimates in our State Energy Data System (SEDS).
The vehicle stock data include all registered on-road, light-duty vehicles and exclude any past vehicle sales that are no longer on the road. The EV charging location data include both private and public access stations for Legacy, Level 1, Level 2, and DC Fast charging ports. The data exclude EV chargers in single-family residences. Between 2020 and 2021, a break in the data series occurs, when the U.S. Department of Energy data were updated to align with the Open Charge Point Interface (OCPI) international standard.
In 2022, the number of registered EVs in the United States was six times greater than in 2016, increasing from 511,600 to 3.1 million, and the number of U.S. charging locations nearly tripled, increasing from 19,178 to 55,015. During the same period, the number of registered EVs in California more than quadrupled from 247,400 to 1.1 million, and the number of charging locations tripled from 5,486 to 14,822.
California’s share of U.S. EV registrations decreased in recent years as EV adoption spread around the country. In 2016, California had about 48% of light-duty EVs in the United States, which was about 12 times more than the state with the second-most EVs, Georgia. In 2022, California had about 37% of U.S. light-duty EVs, which was about six times more than the state with the second-most EVs, Florida.
California’s share of U.S. EV charging locations has increased slightly in recent years, in part because of the California Electric Vehicle Infrastructure Project (CALeVIP) that provides funding for installing publicly available EV charging stations. In 2016, about 25% of U.S. EV charging locations were in California, more than four times as many as the state with the second most, Texas. In 2022, California still had more than four times as many EV charging locations as the state with the second most, New York.
Data source: U.S. Energy Information Administration, State Energy Data System
Note: EV=electric vehicle
Growth in the number of registered EVs has outpaced the number of EV charging locations in the United States. In 2016, on average, there were about 27 EVs per charging location in the United States. Alaska had the highest ratio of any state with 67 EVs per charging location, followed by California with 52 vehicles per location.
In 2022, on average, there were 55 EVs per charging location in the United States. New Jersey had the highest ratio of any state at 100 EVs per charging location, followed by California with 75 EVs per location.
Similar Stories

EIA gasoline prices July 14,2026
View Article
PowerCell secures multi-MW Power Generation order for AI data center
View Article
Fuel price shocks ripple through freight markets
View Article
How offshore industries can reduce water pollution risks
View Article
The United States produced more crude oil than any other country in 2025
View Article
Shell to sell Sprng Energy group to Aditya Birla Renewables Limited
View ArticleGet the most up-to-date trending news!
SubscribeIndustry updates and weekly newsletter direct to your inbox!
Follow us on social media:
![]()
![]()


