August / mid-September 2020: air cargo before the “second wave”
Sep 22, 2020Based on the data for over 1.5 million shipments, August showed a year-over-year (YoY) drop of 17.2% in worldwide volume and of 29% in shipments carried, but a YoY increase in revenues (USD) of 37%, thanks to rates in USD that were 65% higher than the year before (2.83 vs 1.71). YoY, the origin region Asia Pacific lost least volume (-10%), whilst the origins Europe and MESA (Middle East & South Asia) lost most (-25% resp. -22%). North America was – not for the first time – the one region that could not compensate the YoY loss of volume with a sufficient rate hike. But month-over-month (MoM), revenues from North America went up just slightly (+0.3%) whilst worldwide revenues dropped by -1.4% MoM. Preliminary figures for the first half of September indicate that volume remains at -17% YoY. Taking a first look at yields in this period, they look stable so far at USD 2.83, the same as in August.

Not a single day passes without news about an upcoming capacity shortage: ‘regular’ autumn shipments coming in or vaccines against COVID-19 hitting the market. Charter capacity is more difficult to come by. Ever since our industry was severely hit by the effects of the pandemic, predictions and reports about sky-high rates have abounded. The most exotic figures doing the rounds, look to be based on incidental shipments. So, at the end of the Northern hemisphere summer, and at the cusp of what may become a ‘second wave’, the moment seems right to take stock of overall air cargo developments since March of this year. It may tell us something about the months to come.
March through August
Looking at the full COVID-19 period up till now, i.e. from the month of March 2020, the following YoY picture emerges: nr of shipments – 36%, chargeable weight -22%, revenues (in USD) +34%, rates/yields +73%, viz. from USD 1.77 to 3.06. This drastic shift in the market took place in a world which produced much less cargo capacity. In February, the YoY capacity figures were perfectly normal, but since then the figures changed dramatically: in June, Available Ton Kilometers were down by 45% YoY, whilst in August, this figure still stood at -39%.
In all origin regions, average monthly yields/rates (in USD) were highest in the month of May, and came down gradually since then: a true rollercoaster in most origin regions (we show the average yields/rates in USD for Feb/May/Aug respectively:
In the top-10 markets, the highest average monthly rate/yield we measured was 9.81 USD (May; China South East – USA Pacific States). In five of these top-10 markets, yields/rates in August were half of what they were in May. Hong Kong had clearly lower yields/rates than China in May, but its yields/rates fell by much less than 50% from May to August.
Of the Top-40 markets in the world in 2019, nine grew in 2020, in spite of (or thanks to) the pandemic (China East – USA Midwest increased its volume by 30% YoY...), whilst six markets dropped from the Top-40. In other words, no revolutionary changes in the market order. But the Top-100 markets as a group certainly improved their position, as they lost much less volume than the smaller markets. Thirty markets of the Top-100 grew in 2020, 11 from Hong Kong and 9 from different parts of China.
Special Cargo did much better than General Cargo in terms of volume (-16% resp. -25% YoY), but the yield/rate change was most telling in General Cargo, partly as a consequence of the many charter and PPE flights recorded under General Cargo. For the first time, yields/rates for general cargo topped those for special cargo as a group:
Charters were important in this period: whilst volumes in all weight breaks decreased considerably in the top markets (ranging from -34% to -25%), shipments over 5,000 kg in these markets showed a volume growth (+2%). And the larger the shipment size, the higher the YoY increase in yield/rate (ranging from +27% to +87%). The increase in Express shipments was also by far the highest among the largest shipments.
We learned another thing in the last few months. By combining the large body of flight and market data available to us, we are now able to distinguish - for a growing number of markets - between rates on passenger aircraft and those on freighters. As an example of this new type of information, see below two markets with different dynamics:
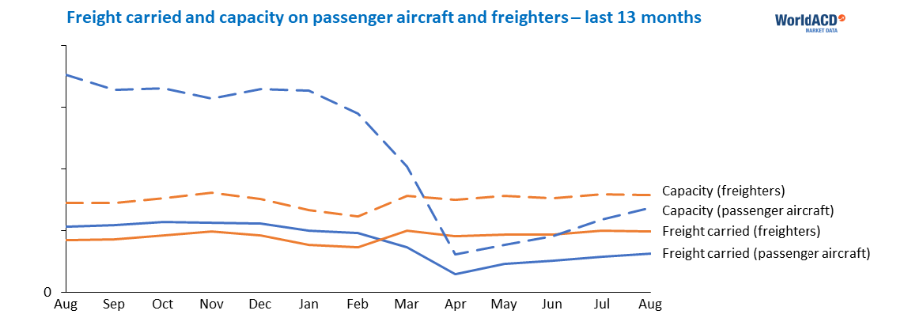
Capacity Growth vs Freight Carried
The number of flights from the first week of July through the second week of September increased by 16%. Whereas the number of freighter flights increased by 2%, passenger aircraft flights increased by 18%. Since June, monthly volumes as a % of last year’s monthly volumes, have hardly been growing, and worldwide capacity-growth is now outpacing volume-growth. The big question facing the industry in the coming months, is to what extent this pattern will be disrupted.

Similar Stories

E-commerce is air cargo golden egg but there’s a downside
View Article
Take-off of French cargo airship startup flying whales neither smooth nor simple but investors keep Faith
View Article
Silk Way AFEZCO and FF Construction collaborate to shape the future of Silk Way Cargo Village
View Article
CPaT announces new contract with Romanian based airline, Legend Airlines
View ArticleJAS Worldwide signs SPA with International Airfreight Associates B.V.
JAS Worldwide, a global leader in logistics and supply chain solutions, and International Airfreight Associates (IAA) B.V., a prominent provider of comprehensive Air and Ocean freight services headquartered in the…
View Article
LATAM is once again part of the Dow Jones Sustainability Index
View ArticleGet the most up-to-date trending news!
SubscribeIndustry updates and weekly newsletter direct to your inbox!


